
Macro Overview
The Fed continued on its steepest rate increase since the early 1980s. Political pushback against the Federal Reserve has been building as criticism surrounding the rate hikes has become a focal issue. October saw a weaker U.S. dollar helping to propel stocks higher as multi-national U.S. companies benefit due to overseas sales.
Third Quarter results for real GDP were released, showing a 2.6% annualized growth rate that followed two consecutive quarters of negative growth, which by many economists’ standards is the official definition of a recession. The recent growth numbers are not expected to mean that the nation has rebounded, and rather GDP is simply treading water. With consumer spending accounting for nearly 70% of GDP, inflation is placing additional pressure on American consumers.
Recent comments by the Federal Reserve indicate that it may consider a more cautious pace of rate hikes as economic activity begins to react to the rapid rise in interest rates. With uncertainty regarding the Fed’s raising of interest rates and the growing expectation for them to pivot, the dollar has slightly fallen from all-time highs versus the euro and pound.
The International Monetary Fund’s most recent World Economic Outlook projected that the global economy has become “gloomy and more uncertain” as a result of inflation, rising rates, and the war in Europe. Revised projections heading into 2023 show less economic growth for most countries, with Russia expecting negative growth. U.S. growth estimates show minimal economic expansion over the next year.
Sources: Federal Reserve, IMF, Treasury Dept., BLS, Bloomberg
Equity Overview
U.S. equity markets rebounded in October with the Dow Jones, S&P 500, and Nasdaq indices all posting positive gains for the month. Technology, health care, and financial stocks were the largest contributors to the S&P 500 Index, sectors that have seen headwinds over the past couple of weeks.
A weaker U.S. dollar added to gains as equity earnings are expected to improve as a result of a weaker dollar. Overseas sales are more profitable for U.S. companies when the U.S. dollar is weaker.
Sources: S&P, Dow Jones, Bloomberg
Fixed Income Review
Short-term Treasury bonds continued to post higher yields than longer-term Treasury bonds. Six-month maturity bonds yielded 4.57% at the end of October, higher than 30-year maturity bonds at 4.22%. Analysts term this dynamic as an inverted yield curve, which is indicative of a recessionary environment.
Mortgage and consumer loan rates held steady in October, which have been hindering the housing and consumer markets. FreddieMac reported the average rate on a 30-year fixed mortgage above 7% at the of October, a level not seen since 2002.
Sources: Freddie Mac, U.S. Treasury, Federal Reserve
Housing Affordability / Series 2 of 2: Home Prices Fall for the First Time in 10 Years - Housing Update
Ever since the housing market plummeted in the 2008 Great Recession, houses have skyrocketed in price. Even with home prices falling, houses are at relatively low affordability levels which a fall in prices which may change in the near future.
The average home price in the U.S. is currently over $525,000, an increase of over $325,000 since 2000 and over $265,000 more expensive than in 2009. In a state like California, where housing prices are much higher, the average home price is around $925,000, a $665,000 increase since 2000.
According to new research, it takes over 8 years of income to currently purchase a home, up from an average of 5 years of income over the past 54 years. However, real wages are declining, and the median U.S. personal income is $44,225. For someone making this income, the average U.S. home is worth almost 12 years of work.
Recent data from an index that tracks home prices across 20 major cities has just shown its first contraction in over a decade- since March of 2012. This means that home prices have fallen, ending a decade-long surge by falling to -0.44% from June to July of 2022. This decline is also the largest fall in the history of the index, falling over 2.8% since the February high. Prices are still the highest they have ever been, but rising mortgage rates have begun to weigh on housing prices which may lead to a cooler or even contracting market. This discourages large loans to be taken out to purchase homes, yet encourages homebuyers who can pay a majority of the home price up-front.
Sources: U.S Census Bureau, U.S. Federal Housing Finance Agency, S&P Dow Jones Indices, Rosenberg Research, World Population Review, Federal Reserve Bank of St. Louis
New Global Growth Estimates Point To Slowdown - Global Economic Trends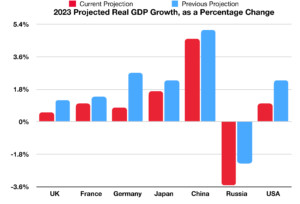
The July 2022 World Economic Outlook revealed that the global economy’s future is “gloomy and more uncertain.” The key economies of China, Russia, Europe, and the United States all have critical issues in the near term, with a continued slowdown predicted by the International Monetary Fund (IMF).
The Ukraine war also contributes to uncertainty and has slowed the global economy. It has prompted the OECD to revise its global growth projections. Even before the war began, supply chain issues were already dampening economic growth estimates. China is facing COVID-19 outbreaks and lockdowns, European countries have been enforcing tighter monetary policy and face the possible end of the Russian gas supply, and Russia’s invasion of Ukraine has no end in sight.
The U.S. represents roughly 62% of the global market capitalization while the US economy only represents 26% of the global economy. Emerging market capitalization accounts for 11% of the global economy while its economic representation is about 35%.
Looking at the IMF’s projections for key economies across the globe is crucial to understanding this slowdown. Compared to previous projections made in April, projections for GDP growth in 2022 and 2023 are down across the board. This means that countries’ economies will grow less than planned for nearly all the major economies such as the United States, Russia, Germany, France, China, and more. Of the 30 countries that make up over 80% of the World’s output, 24 now have lower expected GDP growth for 2023 than they previously did in April of this year.
IMF Economic Counsellor and Director of Research Pierre-Oliver Gourinchas recently stated, "The world may soon be teetering on the edge of a global recession.” Global growth predictions and economists point to a slowdown.
Sources: International Monetary Fund, United Nations
The Hidden Contribution to Inflation - Monetary Policy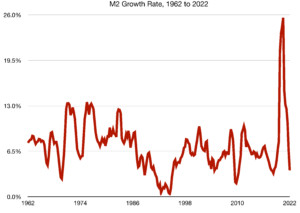
The Fed has increased interest rates by 3% over 3 months, the largest increase since 1982, as a response to the highest inflation in over 40 years. The root of this inflation, in many economists’ eyes, is the historic growth of M2 stock over the pandemic and global turmoil. A barometer of inflation, the money supply (M2), has been expanding significantly since the pandemic began in 2020 with an increase of 26% in 2020-2021, the largest single-year jump in the money supply since 1943.
Money supply and inflation correspond significantly to each other, with large increases in the money supply tending to result in heightened inflation. With the U.S. money supply’s recent spike, inflation has begun to rise, with inflation reaching 9% in June of this year.
To combat this inflationary pressure, the Fed has constrained M2 growth, with the inflation rate even surpassing M2 growth in the second quarter of 2022 when inflation reached upwards of 9%. This constraint on M2 has contributed to the emergence of a recessionary environment, as evidenced by two consecutive quarters of negative GDP growth. Yet, inflation remains at 40-year highs, having measured in at 8.2% recently, just a 0.8% fall from this year’s highs. The Fed hopes to bring inflation down further by continuing to increase short-term interest rates, yet may pivot soon as immense political pressure mounts on the central bank.
Sources: U.S. Bureau of Labor Statistics, Board of Governors of the Federal Reserve System, Federal Reserve Bank of St. Louis
IRS Raises 2023 Tax Brackets due to Inflation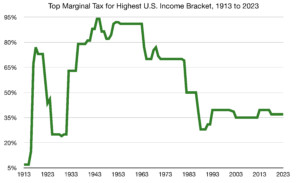
The Internal Revenue Service (IRS) controls the adjustments of tax brackets and standard deductions, and annually makes tax code adjustments based on the cost of living factors, congressional demands, and inflation. The adjustment for 2023, due to 40-year highs in inflation (with inflation currently sitting at 8.2%), was abnormally high.
Thresholds for each tax bracket for the marginal tax rate will go up 7%, and the standard deduction will rise accordingly as well. Thus, marginal taxes will remain the same but will apply to incomes 7% higher rather than their current status in 2022, For example, the top marginal tax rate of 37% previously applied for individual income above $539,900, yet in 2023 will apply to income above $578,125. Individuals making under $578,125 in 2023 will now not need to pay the top marginal tax rate, despite previously needing to in 2022. These rises in thresholds apply to all other income tax brackets, with all brackets rising by 7%. The reasoning behind this is to reduce the effects of high inflation and to save all tax-paying citizens money to some degree.
In addition to these changes making it so individuals can earn more money and still be taxed at a lower rate by the federal government, current taxes are much lower than historical averages. The top income tax rate, currently at 37%, is 20% lower than the average top income tax since its introduction in 1913. The top income bracket tax rate reached as high as 94% in the 1940s and its 100-year average is about 57%.
Also rising by 7% is the standard deduction, which now stands at $27,700 for married couples and $13,850 for individuals, thus allowing taxpayers to shield more of their income from taxes. The annual gift tax exclusion, which an individual can give as a gift to another individual without affecting the aforementioned lifetime limit, will increase by $1,000 to reach $17,000 in 2023.
These increases will all save taxpayers a significant amount of money that would previously go towards taxes. These changes all apply for 2023, and thus taxpayers will see them when filing taxes in early 2024.
Sources: Internal Revenue Service, Wall Street Journal, Tax Policy Center, U.S. Department of the Treasury, Federal Reserve Bank of St. Louis.
**Market Returns: All data is indicative of total return which includes capital gain/loss and reinvested dividends for noted period. Index data sources; MSCI, DJ-UBSCI, WTI, IDC, S&P. The information provided is believed to be reliable, but its accuracy or completeness is not warranted. This material is not intended as an offer or solicitation for the purchase or sale of any stock, bond, mutual fund, or any other financial instrument. The views and strategies discussed herein may not be appropriate and/or suitable for all investors. This material is meant solely for informational purposes, and is not intended to suffice as any type of accounting, legal, tax, or estate planning advice. Any and all forecasts mentioned are for illustrative purposes only and should not be interpreted as investment recommendations.