
Macro Overview – March 2018
Volatility was rampant throughout the markets as fear of inflation and rising interest rates pilfered gains that had accumulated from the beginning of the year. Some see a fundamental trend is in place as a normalization of interest rates evolves.
The release of a jobs report in early February was the catalyst for volatility, as the pace of wage growth was greater than expected thus raising the specter of more aggressive Fed tightening to combat inflation. The Federal Reserve communicated that it is on track to raise rates three to four times this year, stating that “substantial underlying economic momentum” exists for further rate increases.
Historically when markets experience a volatility spike as we experienced in February, a strong economy is a buffer against any long-lasting downturns. Regardless of the catalyst, both stocks and bonds tend to regain their footing following such an environment.
The abrupt rise in bond yields over the past month is in anticipation that the Fed will continue to raise short-term rates this year. The 10-year Treasury yield, which is established by the markets, rose to 2.87% in February from 2.46% at the beginning of the year. The higher yield on U.S. debt is starting to attract additional foreign assets relative to lower yields from other developed countries. The increase in rates is beginning to affect consumer loans from homes and autos to credit cards, and quite possibly offsetting the initial benefits of the recently passed tax cuts.
The roughly 50 percent increase in crude oil prices from lows in June 2017 has helped push inflation higher over the past few months of which oil is an integral component. Economists do not consider inflation a threat to economic prosperity as long as it is gradual and controlled, of which inflation is measured by the Consumer Price Index (CPI).
The Labor Department said the cost of employing the average American worker rose 0.5% in the final three months of 2017 and was up 2.6% in the 12 months ending in December. That’s the biggest 12-month gain for the employment cost index in almost three years. There was a 2.9% jump in average hourly earnings over the past year, the highest increase since June 2009. The average work week fell to 34.3 hours from 34.5 hours.
Sources: Labor Dept., BEA, Federal Reserve, Bloomberg
Rates Starting To Normalize - Fixed Income Update
Bond yields rose in February driven by inflation and additional Fed rate hike expectations. Shorter term rates rose in tandem with longer term rates, as a Treasury two-year note auction brought a yield of 2.25%, the highest since 2008.
A normalization of rates is simultaneously occurring around the globe. Central banks from various countries are scaling back from stimulus efforts and bond buying activities, leading to rising interest rates. In addition, several countries are selling bonds to raise capital, including the UK, Japan, Germany, and the United States.
The issuance of U.S. debt, by bond sales, is expected to increase throughout 2018 as the Treasury raises additional funds to compensate for the budget deficit and loss of tax revenue due to the recently passed tax legislation.
The current status of the economy has led the credit reporting agency Moody’s, to estimate that non investment grade bond defaults will fall to 1.7% by the end of the year, less than half the long-term average of 4.2% going back to 1983.
As rates fell over the past few years, companies are locked in record low interest payments with the average maturity rising from 8.6 years in 2005 to 15.3 years in 2017.
Longer term Treasury bonds now have more of a spread with shorter term Treasury notes, whereas investors see such a steepening yield curve as a sign of economic strength, while flat or inverted is seen as a predecessor to poor economic conditions.
Sources: U.S. Treasury, Bloomberg
Market Volatility – Equity Market Fact
Volatility is an inherent part of the market that occurs when the markets undergo the digestion of new data and or occurrence that alters basic fundamentals and expectations of economic growth and company earnings. Volatility has existed for years and will continue to exist for years to come.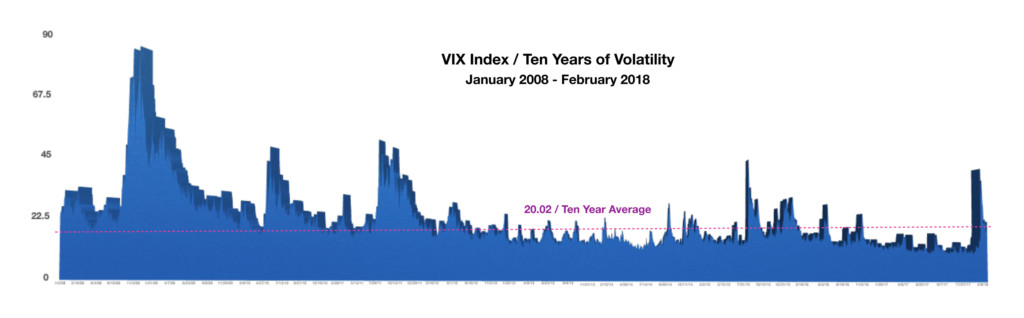
Market volatility is measured by the VIX® Index, which is owned and compiled by the Chicago Board of Exchange (CBOE). The index is calculated by estimating expected volatility for the S&P 500 index.
As of the close of business on February 28, 2018, the VIX Index stood at 19.85, up from 9.77 on January 2, 2018. For the past ten years, the VIX index has averaged a daily closing price of 20.02, almost identical as to where the index closed at the end of February.
Different factors bring about volatility, this time it’s primarily the concern surrounding rising rates and inflation. Market volatility is a function of various factors such as a change in fiscal policy, monetary policy, trade policy, geopolitical events, weather, natural disasters, and currencies.
Historically, volatility has always existed and will undoubtedly continue to exist. Investors seeking to shelter their holdings from market volatility take different actions and use various strategies. Volatility is viewed from different perspectives as some see volatility as a hindrance while others view it as an opportunity. Regardless of how it is perceived, being prepared for future volatility is essential in sustaining valuations.
Sources: CBOE, Bloomberg, S&P
Why the Fed is Optimistic About The Economy – Monetary Policy
The Federal Reserve has countless amounts of data available at its disposal for analysis. The Fed continuously searches for new data sources and methods of identifying and projecting economic activity. The search led to The Federal Reserve Bank of Atlanta developing a proprietary model for the Fed known as GDPNow.
The GDPNow model utilizes what the Fed calls “nowcasting”, a form of advanced forecasting used for weather forecasting. Technology has allowed such models to evolve thus yielding more timely and accurate forecasts that are continuously being revised. The revision at the end of February, released March 1st, projects GDP growth for the 1st quarter of 2018 at 3.5%, following recent data for consumer spending and manufacturing.
GDP (Gross Domestic Product) is the key measure of economic activity in the United States, however, GDP figures are released on a delayed basis, thus not providing an accurate representation of the true economic environment. The GDPNow model addresses the delay issue by providing more “real time” forecasts producing more accurate projections
Source: Federal Reserve Bank of Atlanta
What A Tariff On Steel & Aluminum Means – Trade Policy
A report released on February 16th by the Department of Commerce prompted the President to enact tariffs on steel and aluminum imports entering the United States. The imposed tariffs, essentially a tax on steel imports of 25% and 10% on aluminum imports are in response to the findings of the Commerce Department report and carried out under Section 232 of the Trade Expansion Act of 1962.
Detailed in the Section 232 report are findings that excess imports into the United States of steel and aluminum pose a threat of “weakening of our internal economy” and “threaten to impair the national security” of the country.
The United States is the world’s largest importer of steel, with imports exceeding exports by nearly four times. Demand for steel and aluminum is driven by various industries including automotive, aerospace, consumer goods, and defense. Steel and aluminum are also indispensable materials used in building and expanding a country’s infrastructure.
Ten steel furnaces have closed since 2000, displacing over 52,000 U.S. steel workers since January 2000. Meanwhile, international production of steel is up over 127% since 2000, employing tens of thousands of workers globally. China is by far the largest producer of steel worldwide, as well as the largest source of excess capacity, which is why China is a target for the new tariffs. China alone produces more steel in one month than the U.S. does in a year.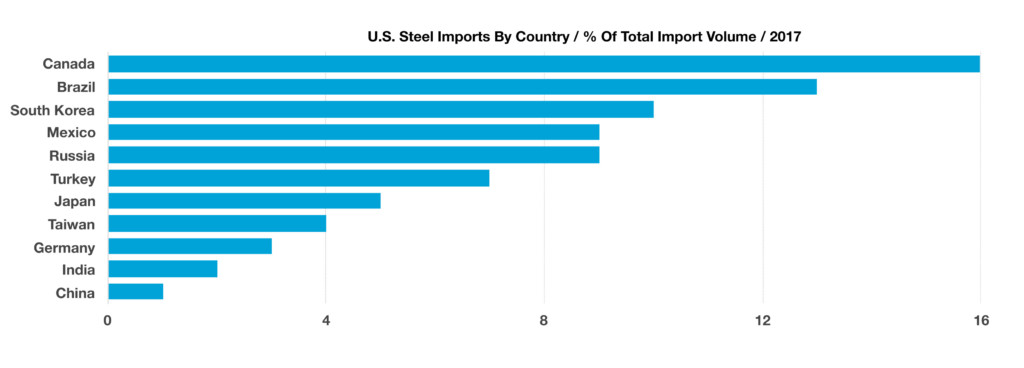
Several countries are being targeted for the newly imposed steel tariffs, notably Canada, Brazil, South Korea, and Mexico. The Section 232 report has determined that these countries have been selling steel into the U.S. market at below market prices, thus dumping steel onto the market. The dumping practices of these countries has led to unfair competition by U.S. steel firms, not allowing them to gain market share. Meanwhile, world steelmaking capacity has increased 127% since 2000, reaching 2.4 billion metric tons. Global excess capacity is 700 million tons, nearly 30% of this total.
Between 2013 and 2016, U.S. aluminum industry employment fell by 68%. Six smelters shut down, and only two of the five remaining smelters are operating at full capacity, despite an increase in U.S. demand for primary aluminum. There is only one remaining U.S. producer of high-quality aluminum alloy needed for military aerospace needs, and maintaining and upgrading our infrastructure, which must be done for reasons of economic security, is a major use of aluminum.
Many are worried about what the impact will be for American consumers and businesses. Economists believe that the initial effect on consumers will be slightly higher prices for aluminum can products and autos. The automotive and aerospace industries will initially be impacted until U.S. steel and aluminum producers come online to restore ample supply. Many see the dynamics as short-term pain for long term gain.
Sources: Dept. of Commerce, ITA Global Steel Trade Monitor, December 2017, Commerce.gov/section232
*Market Returns: All data is indicative of total return which includes capital gain/loss and reinvested dividends for noted period. Index data sources; MSCI, DJ-UBSCI, WTI, IDC, S&P. The information provided is believed to be reliable, but its accuracy or completeness is not warranted. This material is not intended as an offer or solicitation for the purchase or sale of any stock, bond, mutual fund, or any other financial instrument. The views and strategies discussed herein may not be appropriate and/or suitable for all investors. This material is meant solely for informational purposes, and is not intended to suffice as any type of accounting, legal, tax, or estate planning advice. Any and all forecasts mentioned are for illustrative purposes only and should not be interpreted as investment recommendations.