
Macro Overview
The conflict with Iran and how long the hostilities may linger have become a significant concern for markets. Analysts and economists are not as concerned with immediate effects of the war, but are much more concerned as to the longer term complications for the economy and consumers. A prolonged duration of the conflict could provoke slowing economic conditions brought about by the elevated cost of diesel and gasoline.
Rising gasoline and diesel prices drove inflation higher in May, with a 3.8% jump in the Consumer Price Index over the past twelve months. More troublesome was the wage data release, which after adjusting for inflation fell for the first time in three years. Consumers are increasingly finding themselves restricted from spending on what they truly desire.
Analysts and economists believe that recent stock market gains are being primarily driven by earnings and not revenue projections. Companies exhibiting expanding earnings continue to propel market enthusiasm, while companies lacking earnings expansion are experiencing meager performance.
Hiring in the employment market was much stronger than anticipated in May, encouraging some Fed members to consider raising rates later this year. The Fed closely tracks new jobs and hiring as an indication of economic growth and inflationary pressures driven by wage expansion, which eventually leads to heightened consumer expenditures.
Markets are preparing for three of the largest Initial Public Offerings (IPOs) ever, valued at an unprecedented amount of over $3.5 trillion. SpaceX, Anthropic, and OpenAi are all scheduled to IPO in 2026, with SpaceX debuting in June 2026. These three IPOs could account for as much as 5% of the total value of the domestic stock market. Some analysts and economists are leery of the lofty valuations being assigned to these offerings.
Recently released data reveals that consumers are seeing their highest month over month increases with gasoline and utility costs. Gasoline and other fuels rose 28.8% from April to May 2026, while housing and utilities saw a 22.7% for the same period. Such abrupt increases are leading consumers to save less and spend more on essential goods and services.
Electricity prices on the largest electric grid in the US jumped 76% in the first quarter due to rampant demand from data centers, adding to pressure on the region’s power grid to alleviate the strain on consumers. The nation’s largest grid serves 67 million people across eastern states from New Jersey to Illinois, where a large concentration of data centers in the U.S. are located.
U.S. oil exports jumped to 5.8 million barrels per day in May, a nearly 50% increase over the 3.9 million barrels per day exported in February before the conflict began. The U.S. is currently producing roughly 14 million barrels daily, creating a generous surplus for U.S. refiners and consumers. The elevated prices that foreign buyers are paying as well as refiners operating at full capacity, is contributing to inflated gasoline prices nationwide.
Sources: Dept. of Energy, Federal Energy Regulatory Commission, BLS, Dept. of Labor, Bloomberg, EIA
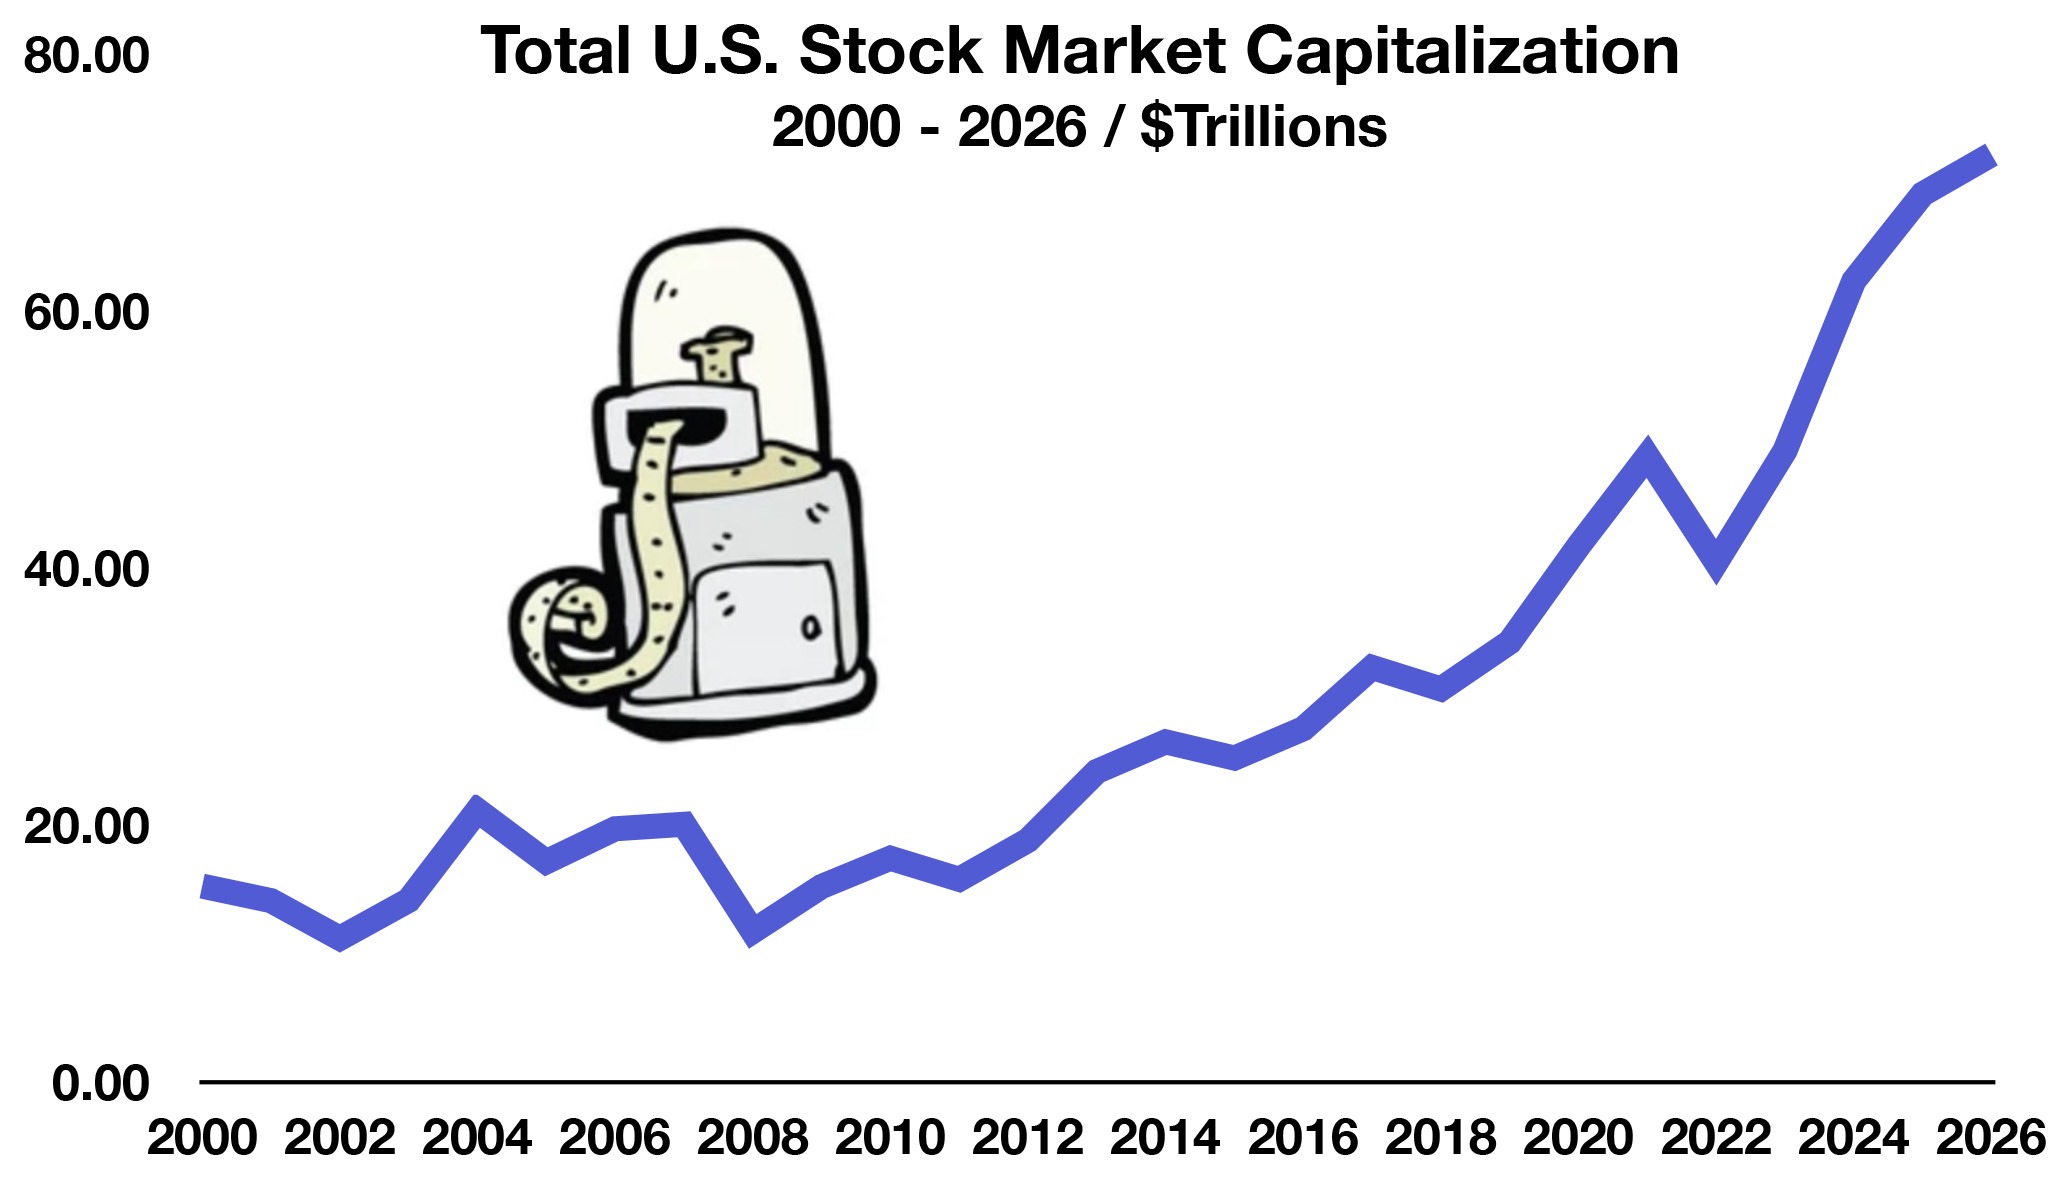
Total Stock Market Valuation Surpasses $70 Trillion - Domestic Equity Overview
Domestic stocks rebounded in May following a volatile first four months of the year. The S&P 500 Index propelled forward in May with advances primarily driven by the technology, consumer discretionary, and healthcare sectors. Current market momentum is being driven by earnings and optimism surrounding the continued build-out of AI infrastructure. Elevated rates are starting to take a toll on various smaller capitalized stocks, which have inherently more debt at higher interest payments.
Markets are preparing for an unprecedented wave of IPOs this year, with one of the largest ever, SpaceX, occurring in June 2026. The combined estimated valuation of SpaceX, Anthropic, and OpenAI is estimated to top $3.55 trillion, representing nearly 5% of total stock market capitalization.
Currently, total market capitalization of the U.S. stock market is roughly $72 trillion, reflecting the combined value of all publicly traded U.S. companies listed on major exchanges such as the NYSE and Nasdaq, while also accounting for nearly half of the entire global equity market.
The U.S. is the largest single concentration of corporate wealth in the history of the world, representing nearly half of the roughly $154 trillion global stock market capitalization. The U.S. market dwarfs the next largest global markets followed by China with about $11.8 trillion total market value and the European Union with an approximate $11.1 trillion capitalization.
Sources: Dow Jones, S&P, IMF
Fed Stuck In A Quandary - Fixed Income Overview
The yield on the 30-year Treasury bond breached 5% in mid May, the highest yield since 2007. Long term maturity Treasuries become more attractive for pension funds, endowments, and income driven investors with 5% plus yields. Historically, elevated bond yields may pose a threat to equites, as investors weigh the risk of equities versus the stability of bonds.
A stronger than expected employment report along with a continuance of high fuel prices, has placed the Fed in a quandary. Markets were anticipating rate cuts by the Fed before year end, but sentiment has changed as the Fed grapples with reigning in inflation and an expanding jobs market. Some Fed members have expressed leaning towards a rate hike in order to fend off inflationary pressures.
Sources: Treasury Dept, Federal Reserve
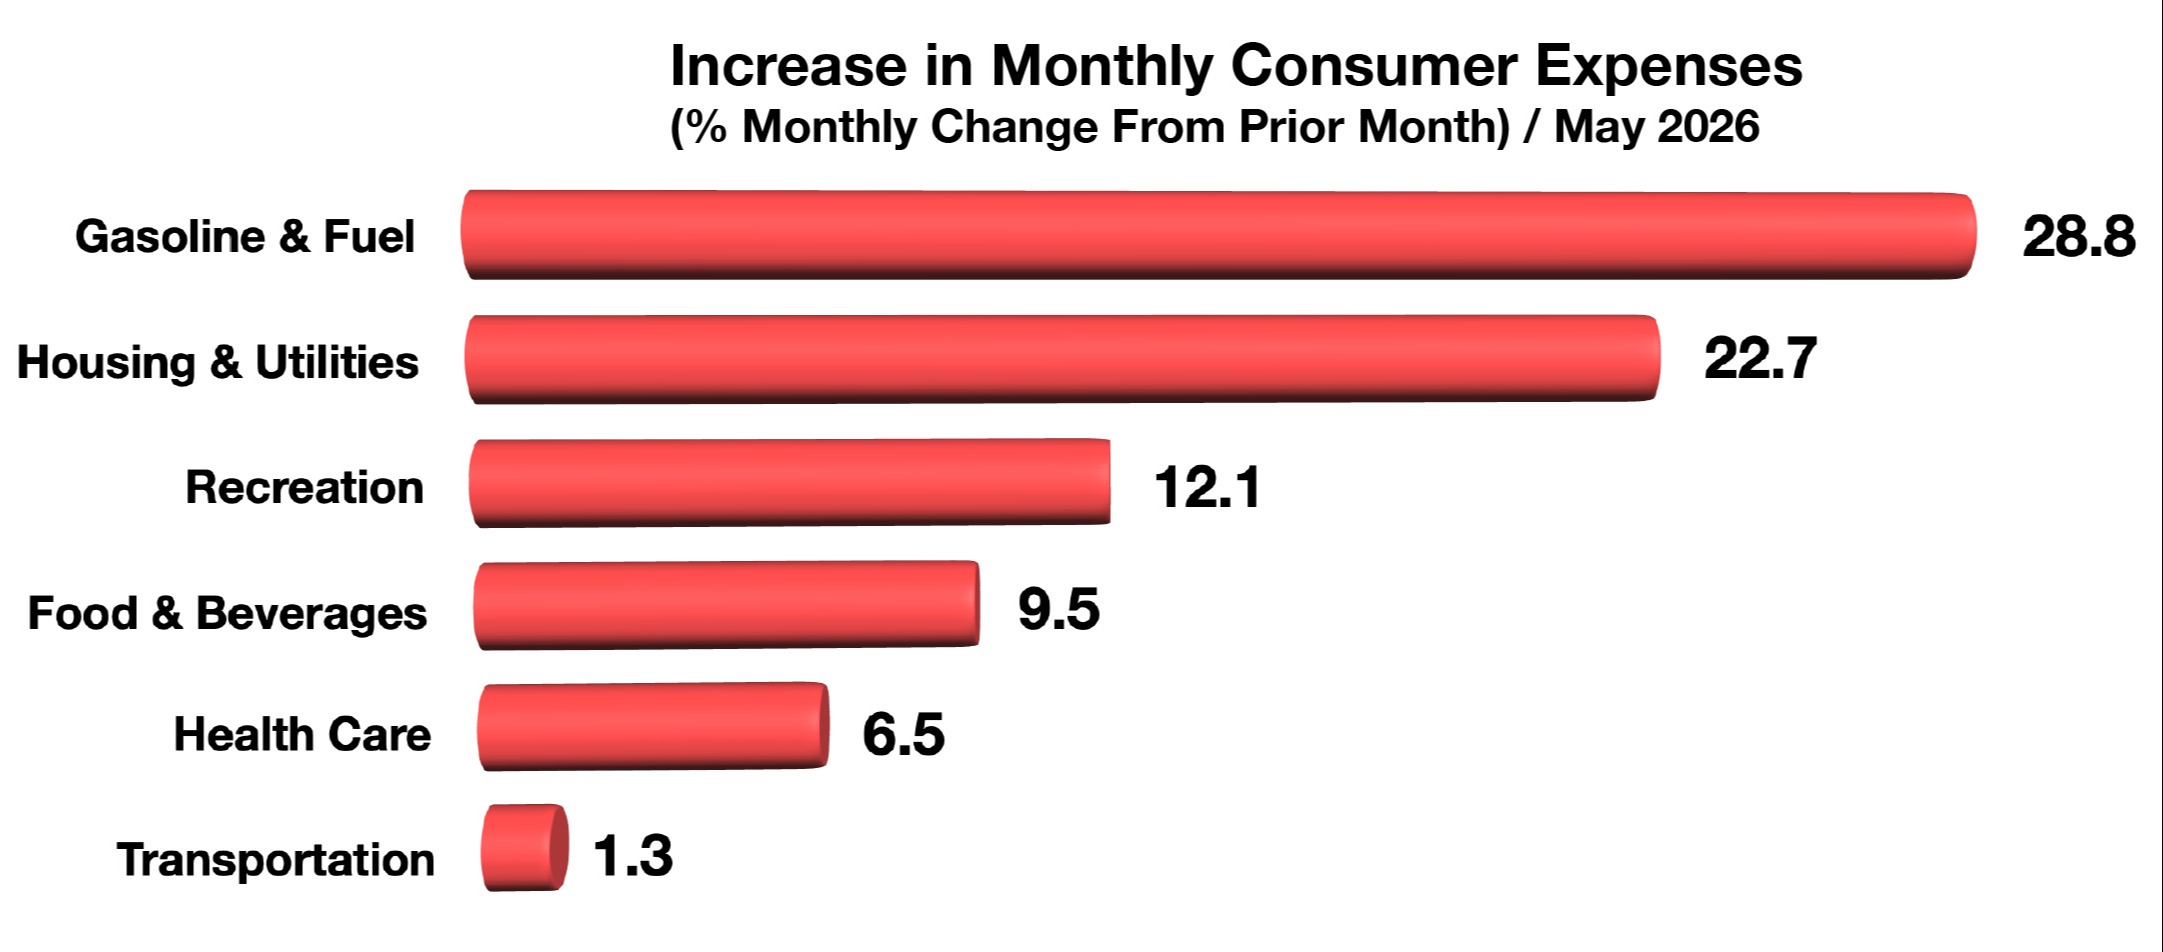
Consumers Saving Less & Spending More On Fuel & Utilities - Consumer Expenditures
Consumers have seen a significant increase in their fuel and housing expenses, hindering their ability to spend elsewhere. Gasoline and fuel costs soared over 28% from April to May, along with housing and utilities rising over 22% for the same period.
Consumers are saving less as they try to keep up with rising costs, with the personal savings rate dropping in April to 2.6%, a dramatic drop from 6.4% at the beginning of 2024. As expenses have risen, consumers have relied more on savings to help supplement their monthly expenditures. Some consumers are starting to experience some financial distress by tapping their credit cards and lines of credit in order to meet monthly expenses.
Sources: BLS, Federal Reserve Bank of St. Louis
How 529s Can Be Converted To Roth IRAs - Financial Planning
When 529 College Savings plans became effective 30 years ago, rules and restrictions limited the use of the funds strictly for college-related expenses. Over the years, updated legislation has alleviated some of these restrictions as well as allowed unused funds to be utilized as a retirement savings vehicle.
In order to qualify to have 529 funds converted to Roth IRAs, the 529 plan must have been open for at least 15 years before a rollover is allowed. If you change the beneficiary, the clock may reset, potentially affecting eligibility. Only funds in the 529 that have been in the account for at least 5 years are eligible for transfer. Contributions and earnings from the most recent 5 years cannot be rolled over. Each rollover is limited by the Roth IRA annual contribution limit for the year ($7,500 for individuals under age 50 for 2026) of the transfer and the amount cannot exceed what you could contribute to a Roth IRA in that year. There is also a lifetime rollover limit of $35,000 per beneficiary. The Roth IRA must be owned by the same beneficiary as the 529 plan, so the 529 beneficiary must be the Roth IRA owner for the rollover to occur. The beneficiary must have earned income at least equal to the amount being rolled over. There are no income limits on who can rollover funds from a 529 to a Roth IRA.
Using a direct trustee-to-trustee transfer from the 529 plan to the Roth IRA avoids taxes and penalties, versus taking money out first as a withdrawal, which could create a taxable event or penalties.
Source: IRS, Section 529 IRS Publication
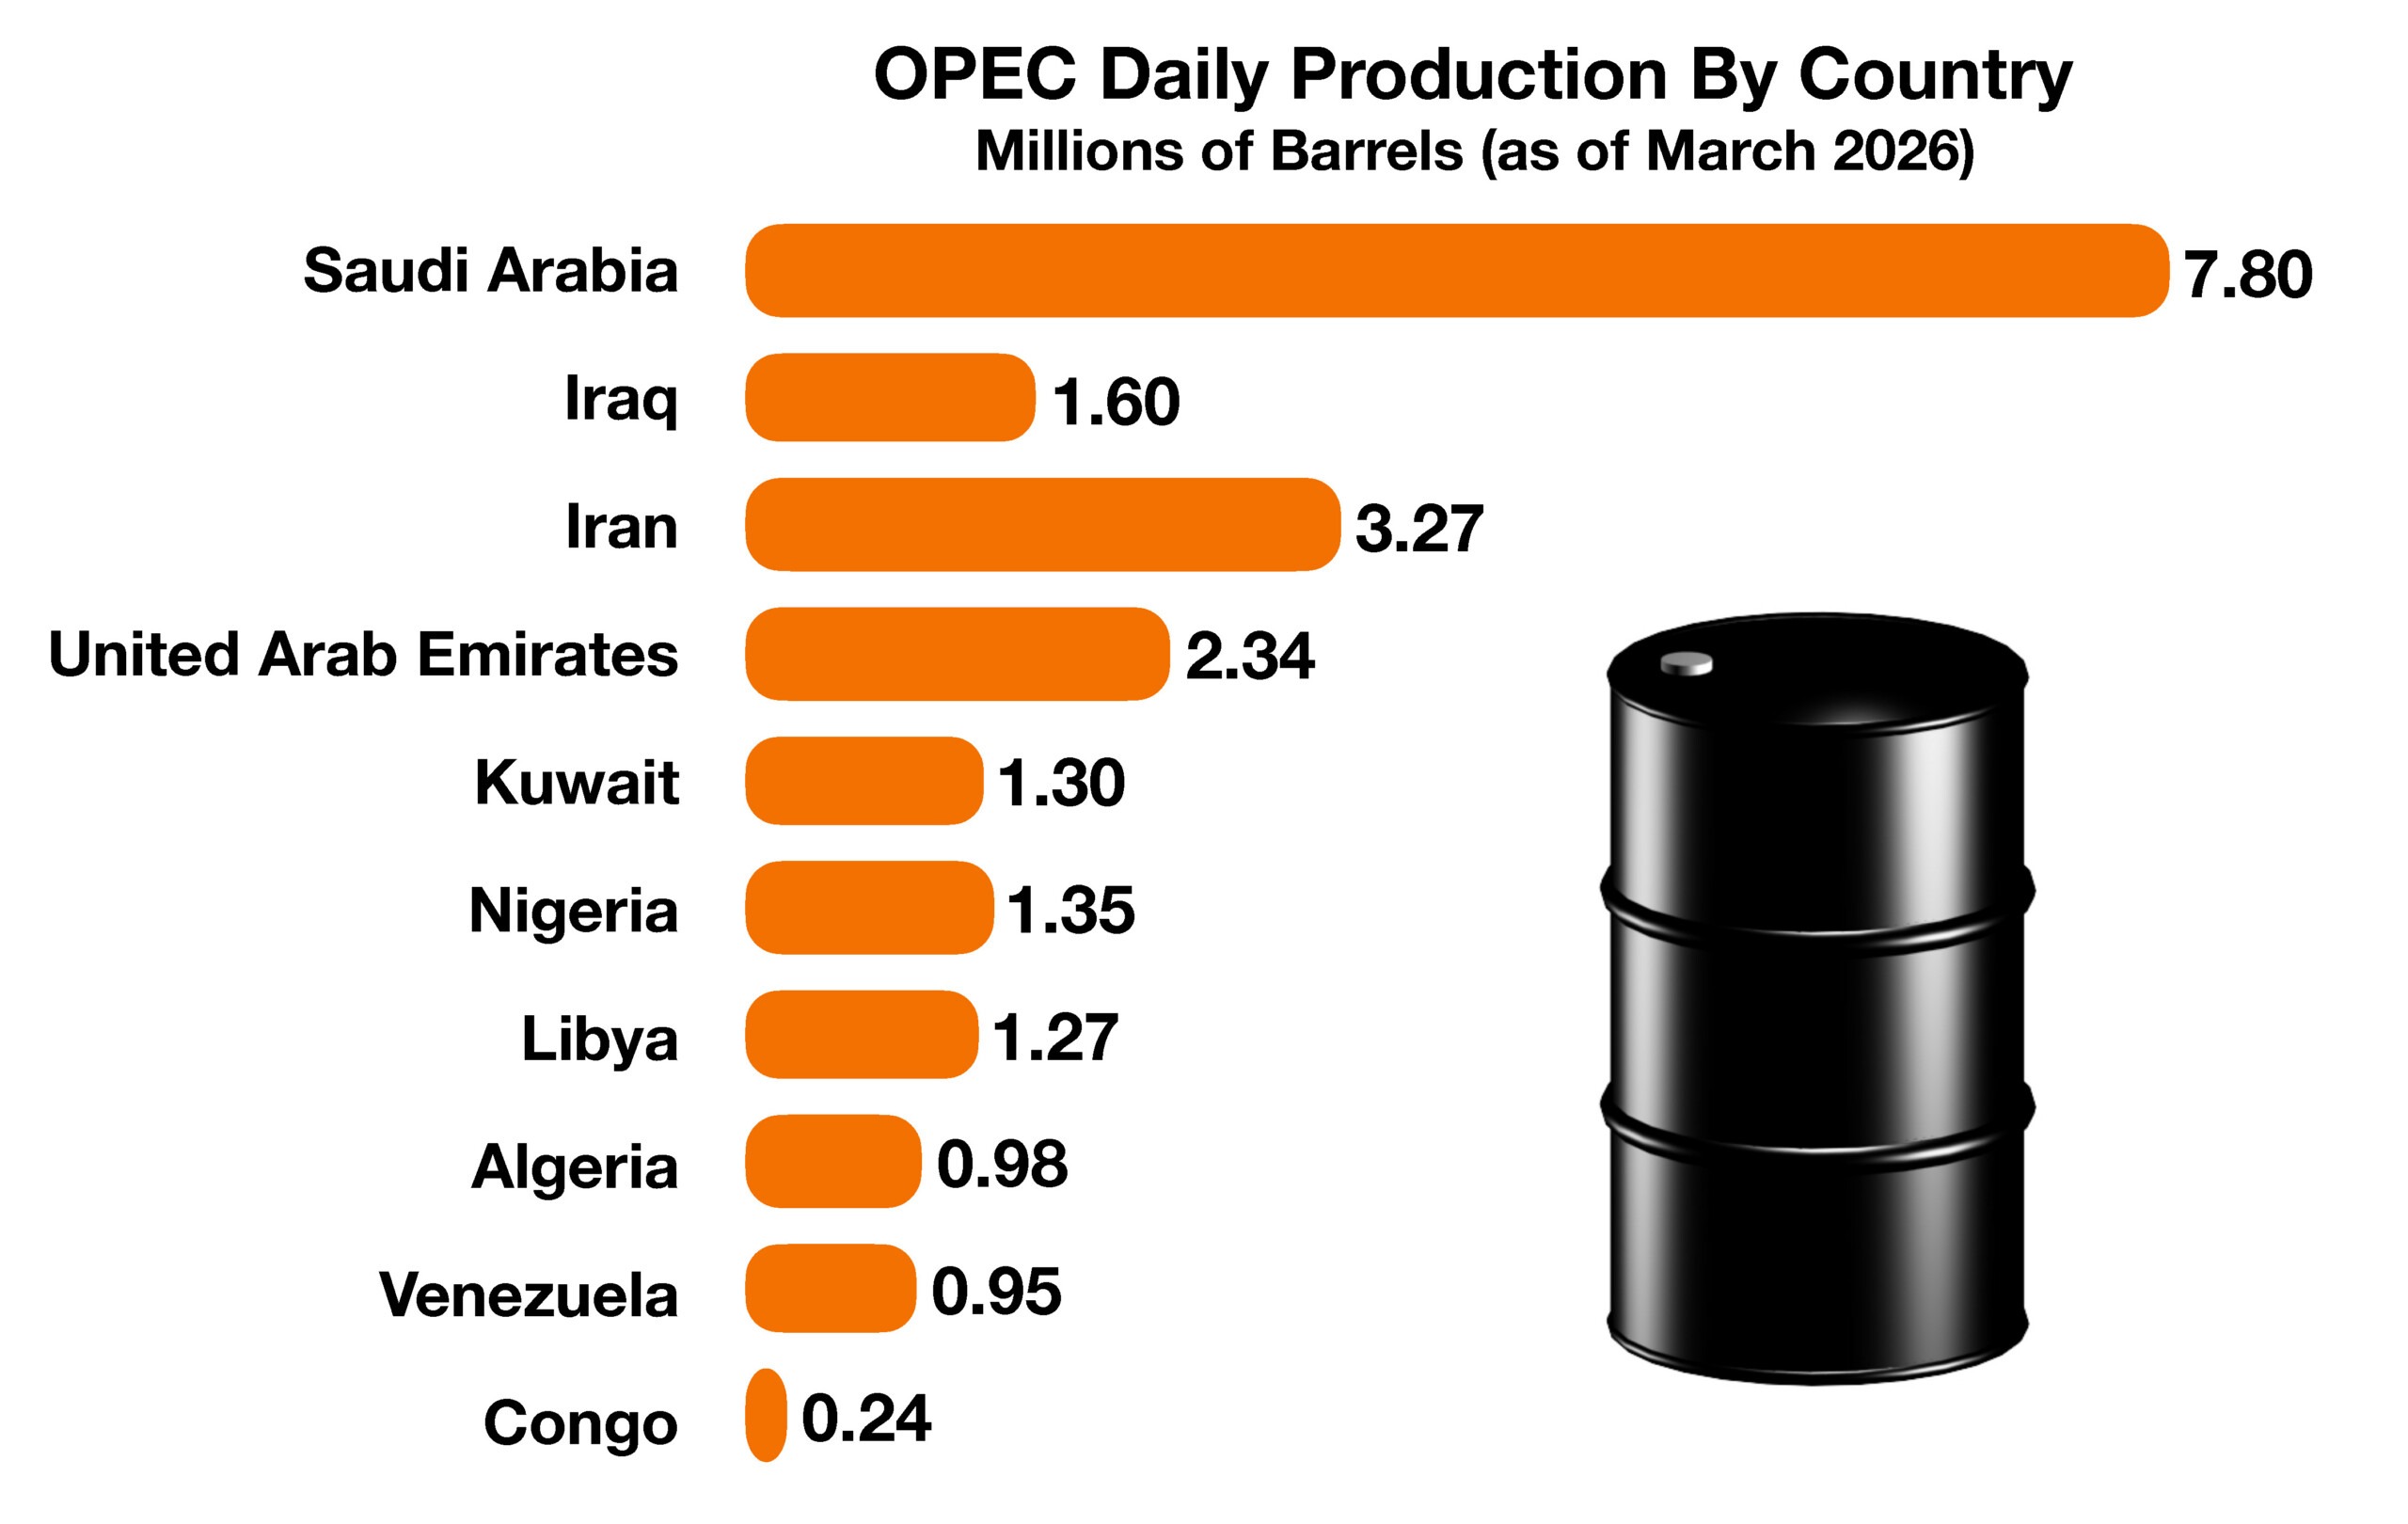
United Arab Emirates Quits OPEC - Global Oil Industry Overview
The departure of the United Arab Emirates (U.A.E.) from OPEC is seen as a significant challenge for OPEC and its remaining members, with the continued existence of OPEC becoming less viable.
Structured as a cartel, OPEC members are subject to fixed oil prices and production limits in order to set and control oil prices globally. After the debut of U.S. fracking, OPEC’s power to sway markets greatly diminished. In response, OPEC teamed with Russia in an attempt to add market share and global pricing power. In recent weeks, OPEC producers have privately complained that attacks by Iran in the Strait of Hormuz have stripped them of their position as the main influence over price swings in the oil market.
By breaking free from OPEC’s rigid quotas, the U.A.E. gains the flexibility to aggressively increase its oil production on its own terms. As one of the world’s lowest-cost oil producers, the U.A.E. has production capacity of 4.8 million barrels a day and is currently allowed approximately 3.4 million barrels a day under OPEC’s quota system. Independent of the group, the U.A.E. will have both the incentive and the ability to increase production.
Producing roughly 13% of OPEC output, the U.A.E. was the fourth largest OPEC producer before the war, then became one of the top three after Iran lost its ability to export its oil production.
The U.A.E. has been at odds with other OPEC members for years, adding tension surrounding production quotas and limitations. Each OPEC member has varying production costs in drilling and production, with some members experiencing increased costs and reduced profitability.
Sources: OPEC, EIA, World Bank Group
**Market Returns: All data is indicative of total return which includes capital gain/loss and reinvested dividends for noted period. Index data sources; MSCI, DJ-UBSCI, WTI, IDC, S&P. The information provided is believed to be reliable, but its accuracy or completeness is not warranted. This material is not intended as an offer or solicitation for the purchase or sale of any stock, bond, mutual fund, or any other financial instrument. The views and strategies discussed herein may not be appropriate and/or suitable for all investors. This material is meant solely for informational purposes and is not intended to suffice as any type of accounting, legal, tax, or estate planning advice. Any and all forecasts mentioned are for illustrative purposes only and should not be interpreted as investment recommendations.