
Macro Overview - June 2017
Political turmoil was not able to derail market momentum in May as the three major market indices continued on their upward trajectory. Delayed passage of
The Federal Reserve Bank of Atlanta’s closely watched GDPNow forecast model is predicting second quarter economic growth of 3.4% growth, a generous number.
The equity market’s rise is broad with small, mid, and large capitalization stocks all rising in tandem, a healthy dynamic as noted by most analysts. As inflation expecta-tions have fallen, the equity markets have been rising in hopes of a slower process of increasing rates by the Fed.
Globally, the price of commodities such as iron ore, copper and oil have fallen since the beginning of the year. A weaker dollar is also buoying emerging markets as their currencies rise to fend off inflationary pressures in emerging market economies.
Changes in banking rules and regulations may be in the air as the Trump Admini-stration made its first major regulatory change, replacing the head of the Comptrol-ler of the Currency, the banking industry’s primary regulatory entity.
The
Congressional leaders reached a bipartisan agreement to fund the U.S. government through September. The omnibus spending measure provides nearly $1.2 trillion of funds until leaders meet again in the fall to formalize longer term spending provi-sions.
The Treasury department is exploring the issuance of longer term bonds maturing in 50 and 100 years. Current ultra low rates encourage debt issuance for longer pe-riods of time.
Puerto Rico sought court protection in the largest ever U.S. municipality bankruptcy, owing over $72 billion to creditors, including Puerto Rican municipal bond holders. Detroit’s bankruptcy in 2013 amounted to $18 billion, which at the time was con-sidered the largest municipality to go bankrupt.
Moody’s & S&P credit rating agencies both downgraded the credit quality of Illinois state municipal bonds to one notch above junk status, giving it the lowest rating of all 50 states. Illinois state legislators’ impasse on passing a budget and spending cuts led to the downgrades.
The Fiduciary Rule goes into effect on June 9 after being postponed two months from its original effective date of April 10, 2017. Created by the Department of La-bor two years ago, the Department’s definition of a fiduciary demands that advisors act in the best interests of their clients and to put their clients' interests above their own. It leaves no room for advisors to conceal any potential conflict of interest, and states that all fees and commissions must be clearly disclosed in dollar form to cli-ents. All affected financial institutions will have until January 1, 2018 to fully com-ply.
Sources: Dept. of Labor, Fed, Moody’s, Reuters, Bloomberg
Fixed Income Update – Domestic Bond Markets
U.S. Treasuries strengthened at month end as demand for government bonds in-creased in anticipation of lessening inflationary pressures. The yield on the 10-year U.S. Treasury ended May at 2.21%, down from 2.29% at the end of April.
Inflation, the primary determinant for the Federal Reserve to raise rates has been muted over the past few weeks, allowing confidence to build among investors that rates will not spike up anytime soon.
Fed members this past month suggested a slow yet consistent manner in raising rates. The Fed is being careful to communicate the rise in rates as slow and steady in order to avoid another “taper tantrum” as occurred in 2013 when the Fed spooked markets by aggressive rate hike language.
Sources: U.S. Treasury, Federal Reserve
China Buying U.S. Treasuries Again – Global Fixed Income
Currently valued at over $13 trillion, the U.S. Treasury Bond market continues to be the world’s largest and most liquid bond market, attracting capital from foreign cen-tral banks seeking safety and stability.
Federal Reserve data as of May17 shows that foreign central banks held nearly $3 trillion of the $13 trillion Treasury market, an increase of over $60 billion since the beginning of the year. Of the various foreign buyers, China’s central bank has in-creased its Treasury holdings the most by $29 billion to a total of $1.08 trillion. China is currently the
A reversal in the U.S. dollar has also helped propel buying by foreigners in order to help stabilize their local country currencies. U.S. Treasuries continue to offer higher yields than other developed country debt such as Japan or Germany, attracting yield seekers.
For the first time in almost 30 years, China’s government debt rating was lowered in May by one of the major credit reporting agencies, Moody’s. Such a move could di-minish China’s ability to borrow funds from domestic and foreign investors.
Source: Federal Reserve Foreign Holdings Report, Moody’s

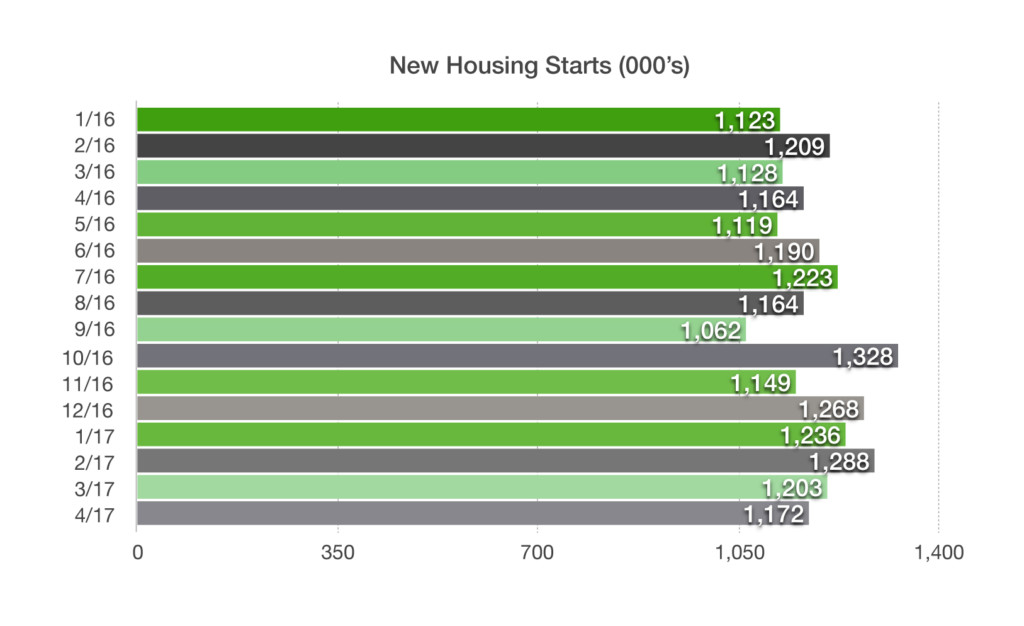
Fewer New Homes Being Built – Housing Market Update
Construction of new single-family houses fell 2.5 percent in April 2017 from the prior month, according to the most recent data made available by the U.S. Department of Housing and Urban Development. The annual rate of 1,172,000 housing starts only in-creased by 0.7 percent over the past year, validating a dismal growth rate of new homes being constructed.
Fewer homes being built along with a slowly improving jobs market and growing fami-lies has helped escalate the demand for homes across the nation. As demand has been outstripping supply, home prices have been climbing across the country.
In addition, construction of new homes has been despondent as a lack of qualified work-ers has hindered the home building industry since the displacement of jobs during the real estate downturn following 2007. The challenge of hiring stems from skilled workers that left the industry during the downturn and have found other occupations since then.
Source: U.S. Department of Housing and Urban Development
Mortgage Refi Cash Outs On The Rise – Mortgage Market Review
Nearly half of mortgage borrowers in the first quarter of 2017 opted for a cash out option when refinancing. The amount of cash outs is at the highest since the 4th quarter of 2008, when the financial crisis was in motion.
Cash outs were tremendously popular during the housing boom when almost 90% of all refinancing included a cash out option. Cash outs as a percentage of total refis dropped considerably to 12% in 2012 following new rules and regulations.
Also fueling recent cash outs is the rise in housing values that allows homeowners to extract a portion of their equity as cash. Before new regulations, cash outs were available on higher percentages of home values, whereas rules today limit cash outs to much lower loan to value loans.
Sources: Federal Reserve, Federal Housing Finance Agency
What Most Tax Payers Earn -Tax Fact

With tax cuts and IRS simplification proposals on the agenda, tax revenue statistics are focal points as certain taxpayers in various age and income groups may or may not see beneficial changes.
The Internal Revenue Service (IRS) keeps careful detail on tax revenue and how it is broken down. Tax revenue data is based on Adjusted Gross Income (AGI) which is compiled and revised during every tax season.
Of the more than 134 million tax returns filed for tax year 2016, the bulk of returns fell between the $30,000 to $200,000 income range. The median income group of taxpayers earning $50,000 to $75,000 comprised the largest segment of tax payers nationwide with over 18 million filers. The second largest group includes those earning between $100,000 to $200,000, with nearly 16 million filers in 2016.
Demographical factors drive tax revenue, such as middle-aged, dual income house-holds tending to earn more for a longer period of time. The amount of income also determines the number of filers in each income group. For 2016, there were only 3,469 taxpayers reporting $10,000,000 or more in income and 1,086,092 filers re-porting no income.
Source: IRS

**Market Returns: All data is indicative of total return which includes capital gain/loss and reinvested dividends for noted period. Index data sources; MSCI, DJ-UBSCI, WTI, IDC, S&P. The information provided is believed to be reliable, but its accuracy or completeness is not warranted. This material is not intended as an offer or solicitation for the purchase or sale of any stock, bond, mutual fund, or any other financial instrument. The views and strategies discussed herein may not be appropriate and/or suitable for all investors. This material is meant solely for informational purposes, and is not intended to suffice as any type of accounting, legal, tax, or estate planning advice. Any and all forecasts mentioned are for illustrative purposes only and should not be interpreted as investment recommendations.