
Macro Overview
Markets reacted to uncertainty surrounding the effect of tariffs on corporate earnings and consumer sentiment, as economists and analysts have found it difficult to determine how much of an influence tariffs have had on profitability and consumers thus far.
The price of various goods picked up in June, a possible indication that companies may be starting to pass tariff costs on to consumers in the form of higher prices. The Consumer Price Index (CPI) rose 2.7% in June from a year earlier, as reported by Labor Department, faster than the prior month’s increase of 2.4%. The price of furniture, toys and clothes, which tend to be sensitive to tariffs, posted larger increases in June.
Progressive deregulation as well as the burgeoning demand for electricity and natural gas driven by the expansion of AI infrastructure (eg. data centers), is creating long term growth dynamics for the utility sector, which has historically never demonstrated growth characteristics.
The U.S. economy grew at an annualized rate of 1.2% in the first half of 2025, while consumer spending grew by 0.9% for the same period. The data is indicating slowing activity and decelerating expansion among various sectors.
Stocks wavered in July due to the challenge of determining how much of the newly imposed tariffs are being absorbed by U.S. companies and consumers. Recent company earnings have revealed that a portion of U.S. companies are absorbing tariff costs while others are passing tariffs along to consumers in the form of higher prices.
Questions surrounding the collection of data by the Bureau of Labor Statistics (BLS), has raised doubt about the accuracy of data revealing employment and labor force statistics. The government’s economic data has been less reliable than usual since the pandemic, undergoing constant revisions that in some cases have dramatically altered perceptions of the economy. The integrity and reliability of U.S. government data is also a critical component of the dynamics and function of the U.S. Treasury market.
Approximately half of retired seniors pay tax on Social Security benefits, which help fund Medicare and future Social Security benefits. Lower tax rates and new tax provisions are expected to reduce revenue into the Social Security Trust Fund and Medicare as estimated by the The Committee for a Responsible Federal Budget (CRFB). Regardless, it is projected that the Social Security Trust Fund will not be able to pay full scheduled benefits as early as 2032. The primary reason for the trust fund's depletion is a declining birth rate and increasing life expectancy which translates into fewer workers contributing to Social Security relative to the number of beneficiaries receiving benefits.
The technology sector has announced more than $1.5 trillion in commitments to investing in the U.S. since the beginning of the year, hoping for favorable policies on tariffs and digital-trade barriers. The investments include the construction of factories, research & development, and employee hiring.
Sources: BLS, U.S. Treasury, Bloomberg, SS.gov, CRFB, WhiteHouse.gov
Equities Navigate Tariffs In July - Domestic Stock Overview
Despite ongoing trade tensions and macroeconomic uncertainty, domestic equities maintained on upward momentum in July, with the S&P 500 index and Nasdaq increasing in July. Propelled by strong corporate earnings and renewed consumer sentiment, equities were resilient to ongoing trade and data headwinds. Information technology, utilities and industrials were the leading sectors in July, while other sectors were mixed.
The weak employment data release was of concern for the stock market since less companies are hiring and more workers are finding it increasingly difficult to land a job. Such labor market dynamics can slow economic growth and curtail inflationary pressures.
Sources: Bloomberg, S&P
Rates Uncertain Until Fed Decides On Further Cuts - Fixed Income Update
Fixed income indices had a mixed month, with Treasuries experiencing fluctuating long-term yields, reflecting investor concerns over inflation and economic growth. Markets reacted to poorer than expected employment data released by the Bureau of Labor Statistics (BLS) by sending bond prices higher and yields lower at the end of July.
Interestingly enough, the weak jobs data release actually helped the Fed as markets drove bond yields lower without the Fed having to take any action. Employment data is critical for the direction of bond yields since a weakening jobs market is indicative of slowing consumer expenditures and alleviating inflation.
The rate on a 30-year fixed conforming mortgage fell to 6.72% on July 31st, down from 6.91% at the beginning of the year. Any reduction by the Fed is expected to help buoy the housing market with lower mortgage rates.
Sources: FreddieMac, U.S. Treasury, BLS
Consumer Debt Slowly Rising - Household Finances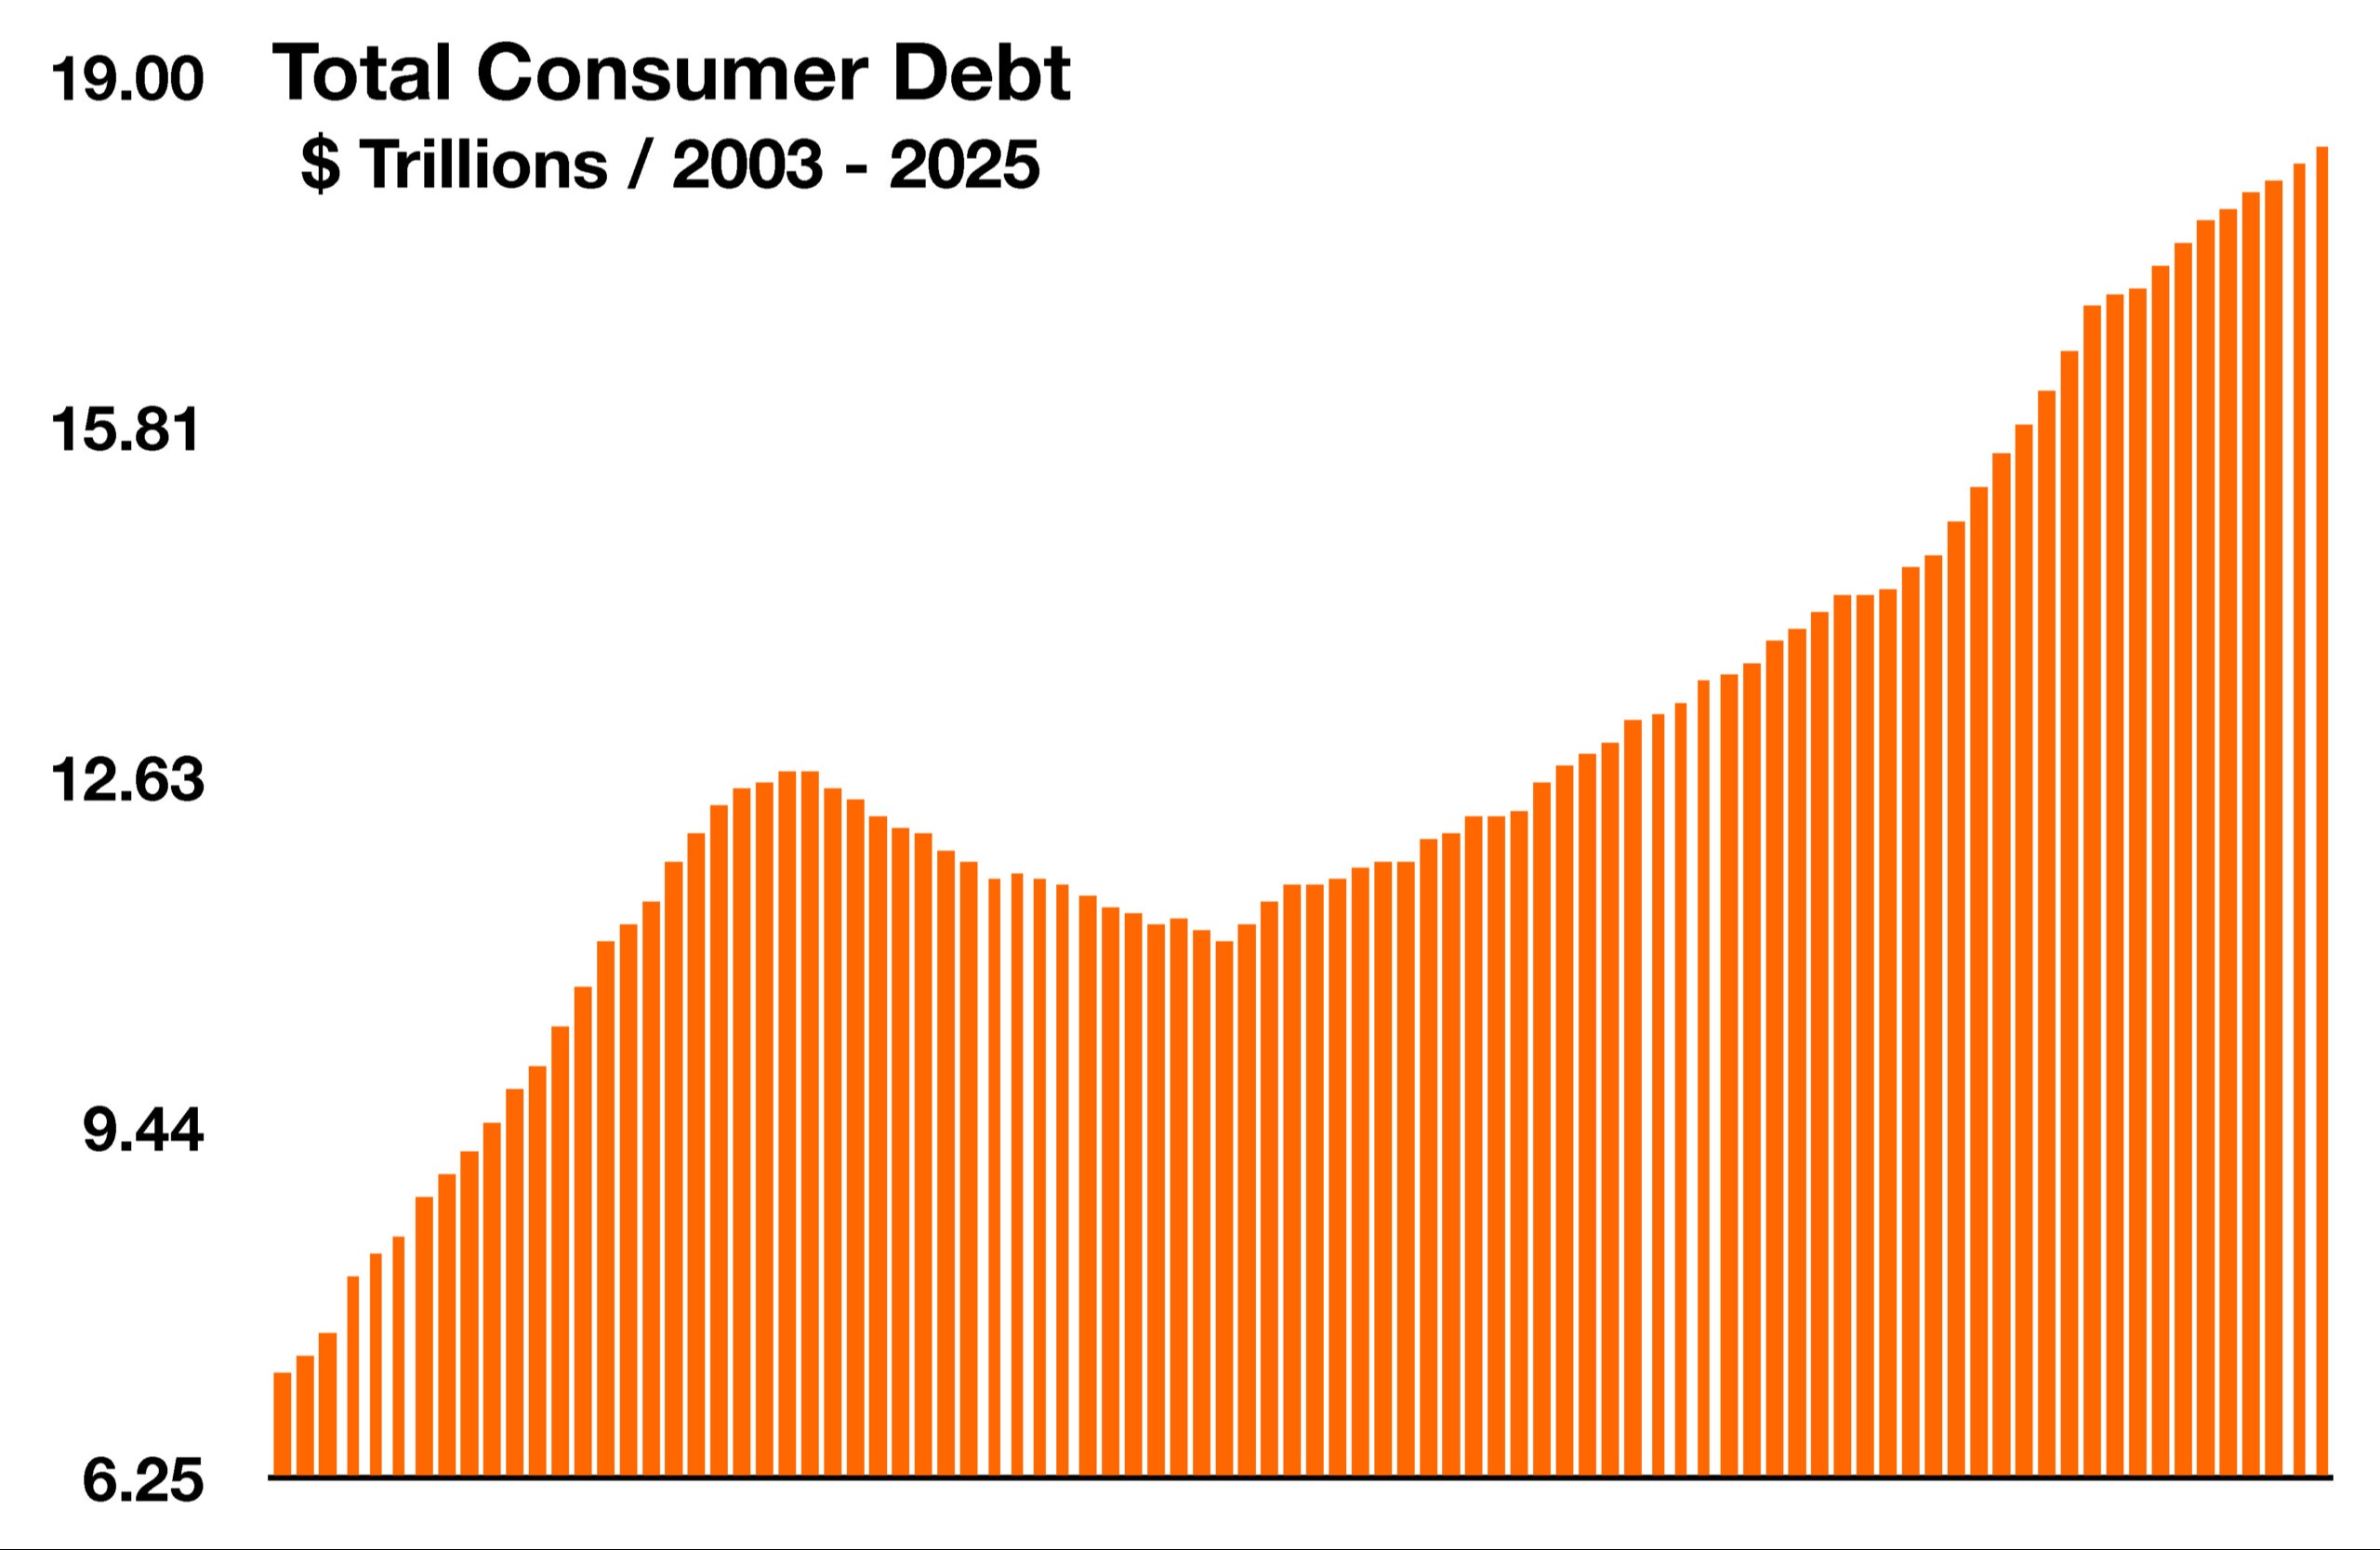
Over the past few months consumers have been adjusting their spending habits, cutting down on discretionary items such as TVs and furniture, while shifting purchases to more affordable brands and products. Ongoing elevated prices have been a burden to consumers as wages have not been keeping up with many of the price increases. In doing so, consumers have been relying more on debt in order to make payments and afford essential items. Total outstanding consumer debt increased to $18.38 trillion in the second quarter of 2025, up from $14.3 trillion at the beginning of the pandemic in the first quarter of 2020.
Total consumer debt includes mortgages, credit card balances, home equity lines of credit and student loans. All loan types have been steadily increasing over the past few years, yet mounting credit card debt is becoming concerning for banks and financial institutions that lend the funds. Credit card debt accounted for 6.5% of total consumer debt in the second quarter of 2025, up from 5.3% three years ago in 2022. Economists closely watch rising consumer debt as an indicator of any financial strain on household spending.
Sources: Federal Reserve Bank of St. Louis
What Prompted The Turmoil With The Government’s Employment Data - Government Agency Overview
The firing of the Commissioner of the Bureau of Labor Statistics prompted questions as to how employment data is collected and what may have triggered the termination. Regardless, the financial community did not dismiss the firing as justified. Concerns surrounding the accuracy of government data drew attention since such data is incredibly critical for the determination of fiscal and monetary policy initiatives.
The process of employment data collection has been mired with flaws since the onset of the pandemic in 2020. What used to be face to face surveys of businesses and corporate human resource departments, dwindled into an online questionnaire riddled with muddled questions.
The BLS surveys about 121,000 businesses and government agencies, covering approximately 631,000 worksites. The survey is conducted monthly and collects data from companies’ payroll records on employment, hours, and earnings. Primary data collected in these surveys include, number of employees on the payroll, hours worked, wages paid, as well as overtime and part-time status. Data collected from these surveys are used to generate the widely cited monthly Employment Situation report, which translates into the releases followed by the Fed, the White House, analysts, and economists.
An entity known as The Office of Survey Methods Research (OSMR) evaluates data collecting methods by the BLS, investigates alternatives, and develops new methods to improve the efficiency and quality of data. OSMR's tasks are divided into three research centers, Behavioral Science, Data Science, and Mathematical Statistics.
The firing of the BLS commissioner by the President was triggered by unusually large downward revisions to employment gains for June and May. Adjustments and revisions are common for such data, yet the dramatic revisions sowed angst about the credibility of the data. The revised data from the BLS showed the economy added 33,000 jobs in June and May, instead of 291,000 previously reported.Some economists believe that the dramatic revisions were brought about by smaller companies that did not reply to BLS surveys in a timely manner.
Sources: BLS, OEWS, Office of Survey Methods Research (OSMR)
What The European Union Exports To The U.S. - International Trade
The United States imports a wide array of materials and finished products from Europe with the total value of European Union (E.U.) imports into the U.S. totaling over $570 billion in 2024. The most significant imports from Europe to the U.S. are pharmaceuticals and medical products, accounting for roughly $127 billion while automobiles and automotive components constitute about $57 billion in exports to the U.S. Other significant exports to the U.S. include machinery, optical products, electrical components, and organic chemicals.
Trade between the U.S. and the European Union are distinctive from other countries as the E.U. is made up of 27 countries with different economies and political leaders. All trade negotiations with the E.U. are accomplished with the President of the European Commission, who represents all 27 countries for the interests of the E.U. as a whole.
Since labor costs in the E.U. can be restrictive for certain manufacturers, several European auto companies have actually initiated production of autos in the U.S. over the past few years. Part of the current negotiation process does include incentivizing additional transition of production and manufacture to the U.S.
Sources: EuroStat, U.S. Dept. of Commerce
How Autos Have Become More Fuel Efficient Over The Decades - Auto Industry Overview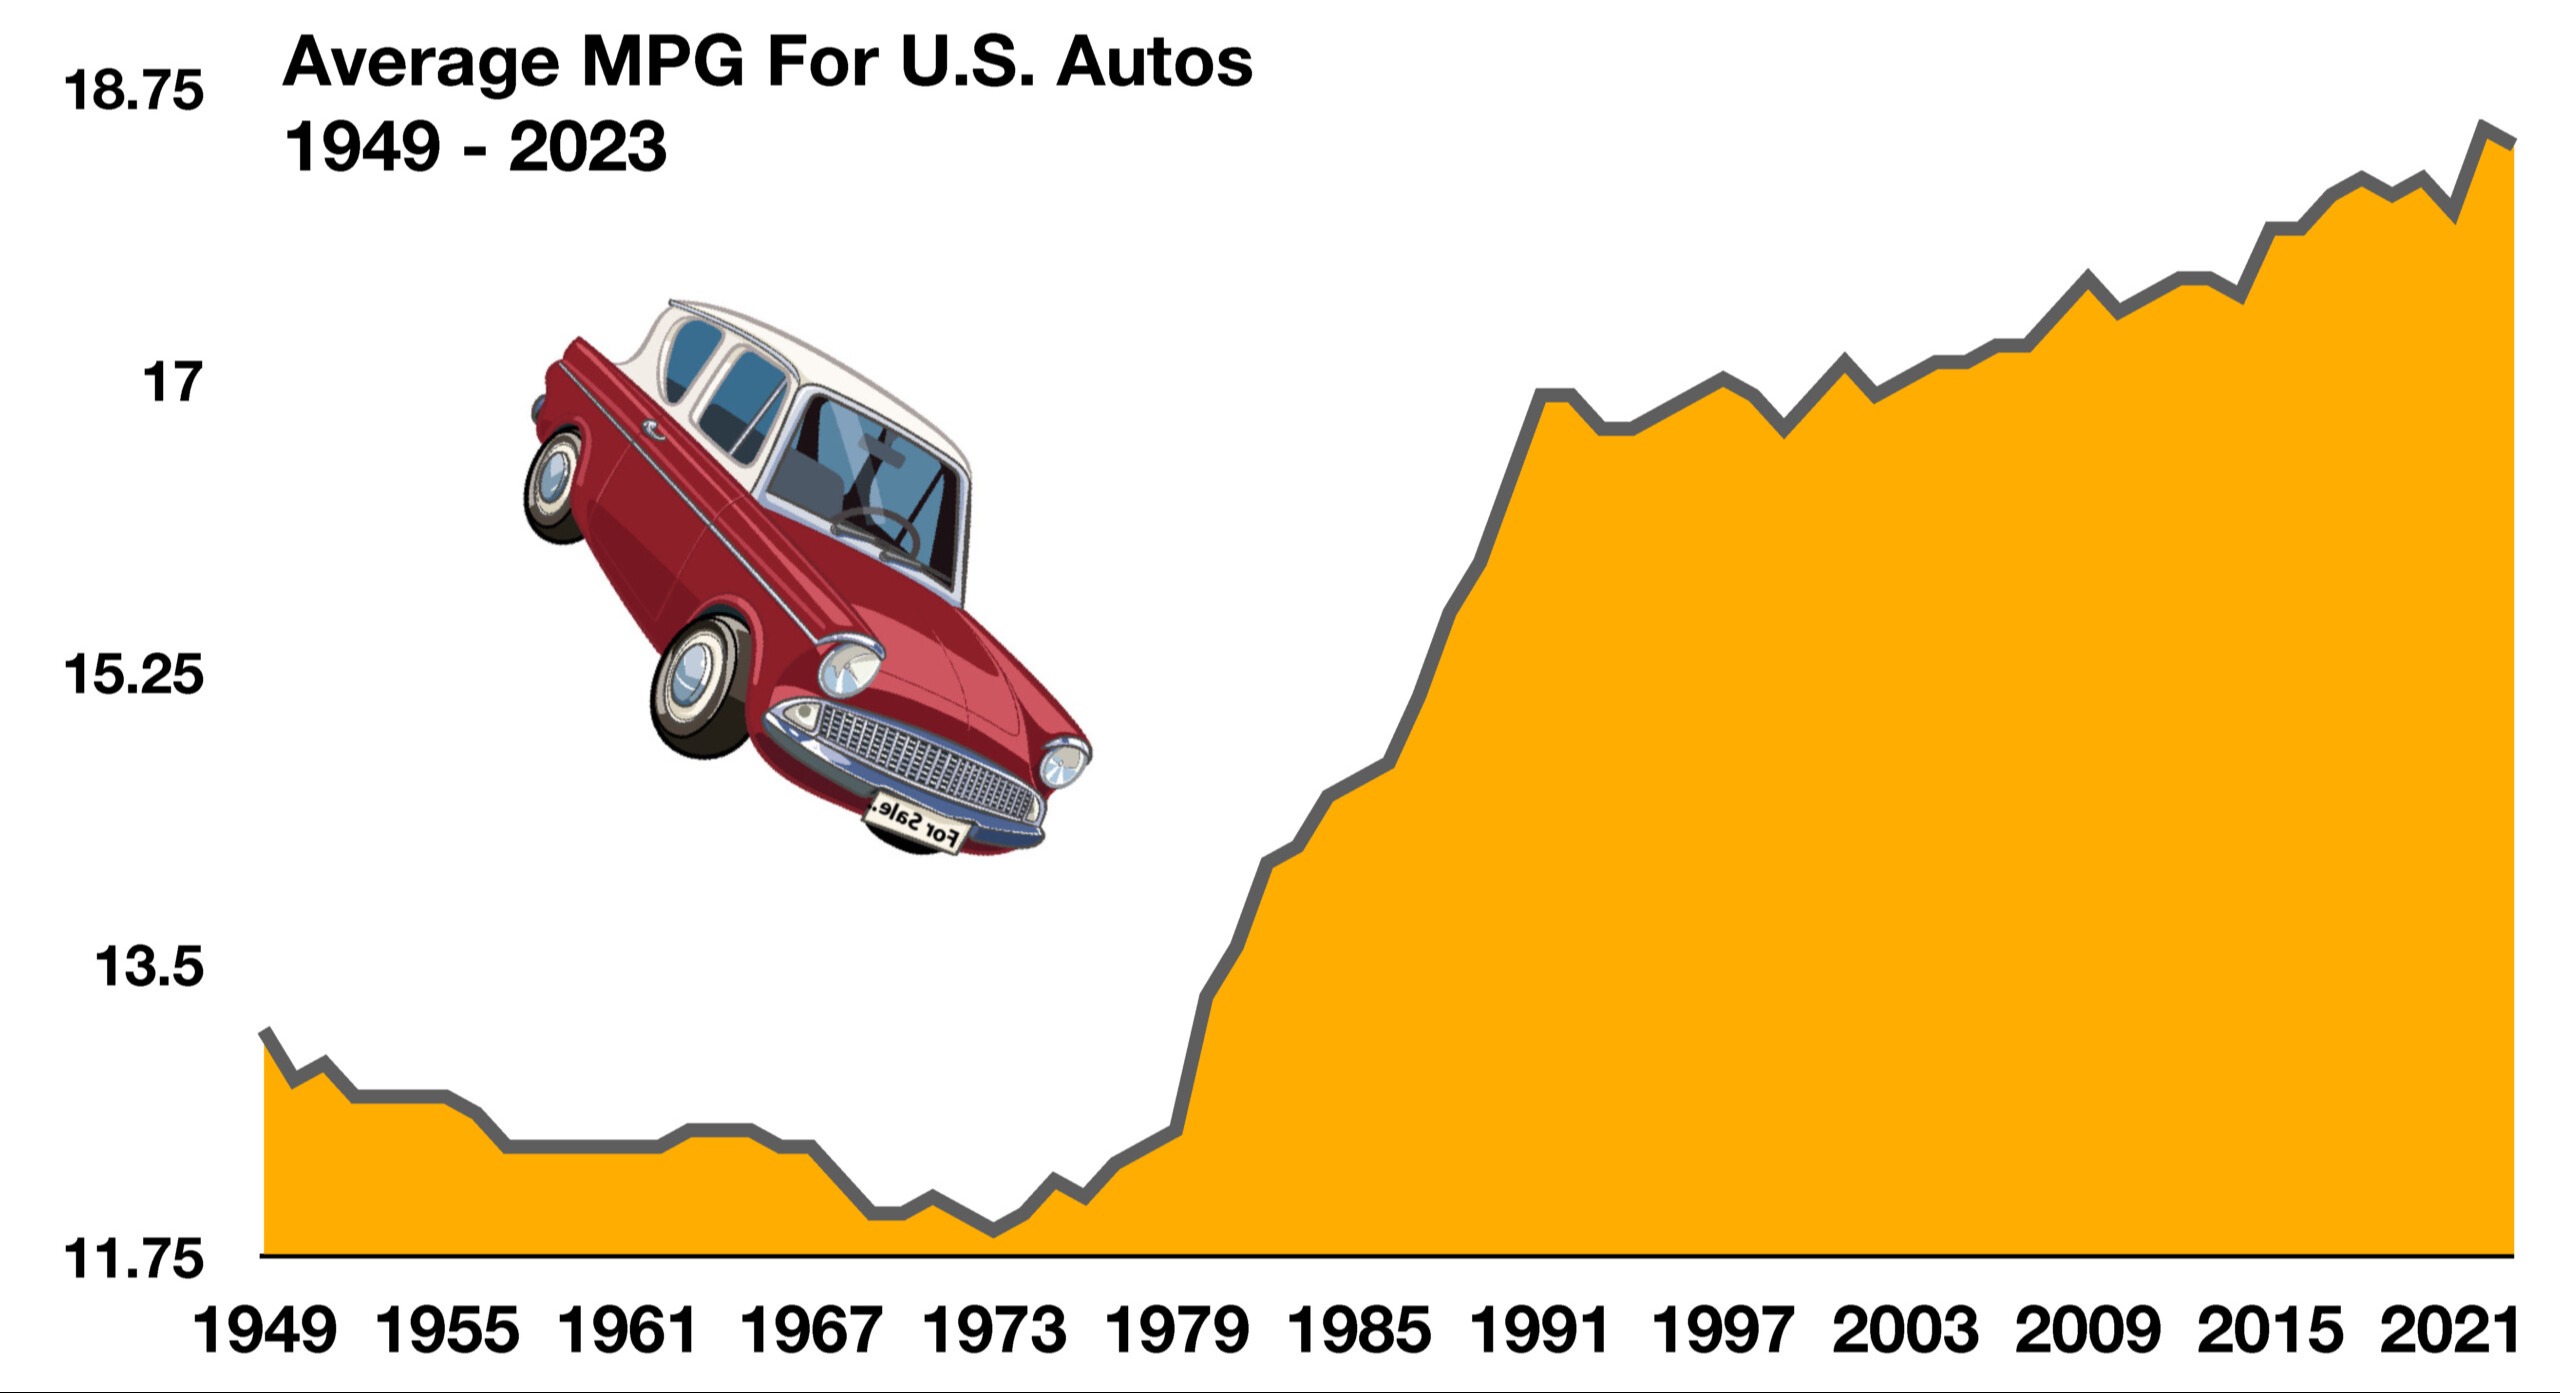
As technological advances have been applied to the auto industry, cars have become more efficient and electronically sensible. Technology has been able to increase horse-power while also decreasing fuel consumption over the past few decades.
Smaller, more efficient 4 cylinder engines now produce the same amount of power as earlier V8 engines from the 70s and 80s that were known as “fuel hogs”. Data collected by the U.S. Energy Information Administration as early as 1949, has shown a gradual decrease in fuel consumption per vehicle, translating into higher miles per gallon (MPG). The average vehicle in 1949 achieved roughly 13 MPG, while the average vehicle as of the most recent data was 18.4 MPG.
The proliferation of electric vehicles has also encouraged auto makers to design even more efficient gasoline engines in order to compete with EVs. Interestedly enough, auto buyers have recently been shying away from EVs due to the charging times required.
Sources: U.S. Energy Information Administration
**Market Returns: All data is indicative of total return which includes capital gain/loss and reinvested dividends for noted period. Index data sources; MSCI, DJ-UBSCI, WTI, IDC, S&P. The information provided is believed to be reliable, but its accuracy or completeness is not warranted. This material is not intended as an offer or solicitation for the purchase or sale of any stock, bond, mutual fund, or any other financial instrument. The views and strategies discussed herein may not be appropriate and/or suitable for all investors. This material is meant solely for informational purposes and is not intended to suffice as any type of accounting, legal, tax, or estate planning advice. Any and all forecasts mentioned are for illustrative purposes only and should not be interpreted as investment recommendations.