
Macro Overview
The Russia-Ukraine war has intensified inflation expectations due to the threat of global supply chains which are expected to be impaired for an extended period of time. Supply chain issues were already wreaking havoc on global manufacturing, production costs, and consumer availability before the Russian invasion started.
Consumers are rapidly losing purchasing power as rising rates and inflation have created higher borrowing costs for homebuyers and consumers overall. Quickly elevating mortgage rates have some borrowers being disqualified on mortgage loans that had previously been approved.
The Federal Reserve initiated its long awaited rate increase in March, making its first of several additional increases projected this year. Consumer loan rates, mortgage rates, and auto loan rates all increased. The Fed’s objective is to circumvent inflationary pressures by raising rates in order to ease consumer demand for products and services. Economists believe that the tremendous spike in global commodity prices is creating commodity-led inflation, which increases costs for production, manufacturing, and consumers globally.
The pandemic-induced demand for homes nationwide may eventually subside as mortgage rates have reduced affordability for millions of homebuyers. The average 30-year conforming mortgage rate rose to 4.67% in March, up from a low of 2.66% in December 2020.
Short-term Treasury bond yields began to move higher than some long-term Treasury bond yields, viewed as an indication of a possible economic slowdown. Rising short-term rates may signal inflationary pressures, while lower long-term rates may suggest a recessionary environment sometime in the future.
A strengthening U.S. dollar over the past few weeks has been the result of global investors seeking stability as the Russian invasion of Ukraine has progressed. Optimistically, a stronger dollar can help stem inflation as it can make imported products less costly for American consumers. The most recent inflation data revealed a 7.9% annual rate, the highest in 40 years, putting pressure on consumers as wages struggle to keep pace with heightened inflation.
Gasoline prices have soared more in certain states than others, with excise gasoline taxes as a culprit. The federal government imposes a tax of 18.4 cents for each gallon sold nationally, yet some states impose an additional gas tax in order to raise funds for state infrastructure and highway projects. Even though the average cost of a gallon of regular gasoline nationally was $4.23 at the end of March, several states saw much higher prices due to additionally imposed excise taxes.
Sources: EIA, Federal Reserve, Freddie Mac, Treasury
Stocks Have A Tough First Quarter - Equity Overview
The yield on the 10-year Treasury bond rose above the S&P 500 Index yield in March, meaning that the 2.32% yield on the 10 year Treasury bond is more than the 1.32% dividend yield for the S&P 500 Equity Index.
Some analysts believe that current earnings estimates for the S&P 500 Index, which represents a wide swath of the equities market, may be distorted. Almost all of the growth in 2022 earnings for the index since the beginning of the year can be traced to the energy sector alone. The dramatic rise in oil and energy prices have propelled profits for oil and energy companies, which aren’t representative of other sectors.
Major equity indices recouped some ground in March, with the S&P 500 Index , Dow Jones Industrial Average and the Nasdaq all having a positive month. First quarter returns were not as generous, as all three indices saw negative performance with the worst quarter in two years. Some analysts are skeptical if an upward trajectory will continue, while others see fundamental optimism surrounding earnings and economic growth, both of which affect stock prices.
Sources: S&P, Treasury, Dow Jones, Nasdaq
Rates On The Rise - Fixed Income Overview
Global bond yields rose in March as European and Asian central banks concurrently raised rates to help stifle global inflation.
The Fed began to raise rates in March, with its first of perhaps six additional increases this year. Even though the increases are minimal, each increase affects the overall bond market. Treasury and corporate bond yields rose following the Fed’s move, with the anticipation of a continued higher rate environment towards the end of the year.
Shorter term Treasury bonds have begun to yield more than some longer term Treasury bond maturities. Known as an inversion, economists and bond analysts view such a dynamic as indicative of a recessionary environment sometime in the future.
Sources: Treasury, Federal Reserve
Food & Gasoline Making Up More Of Consumer Expenditures - Consumer Inflation 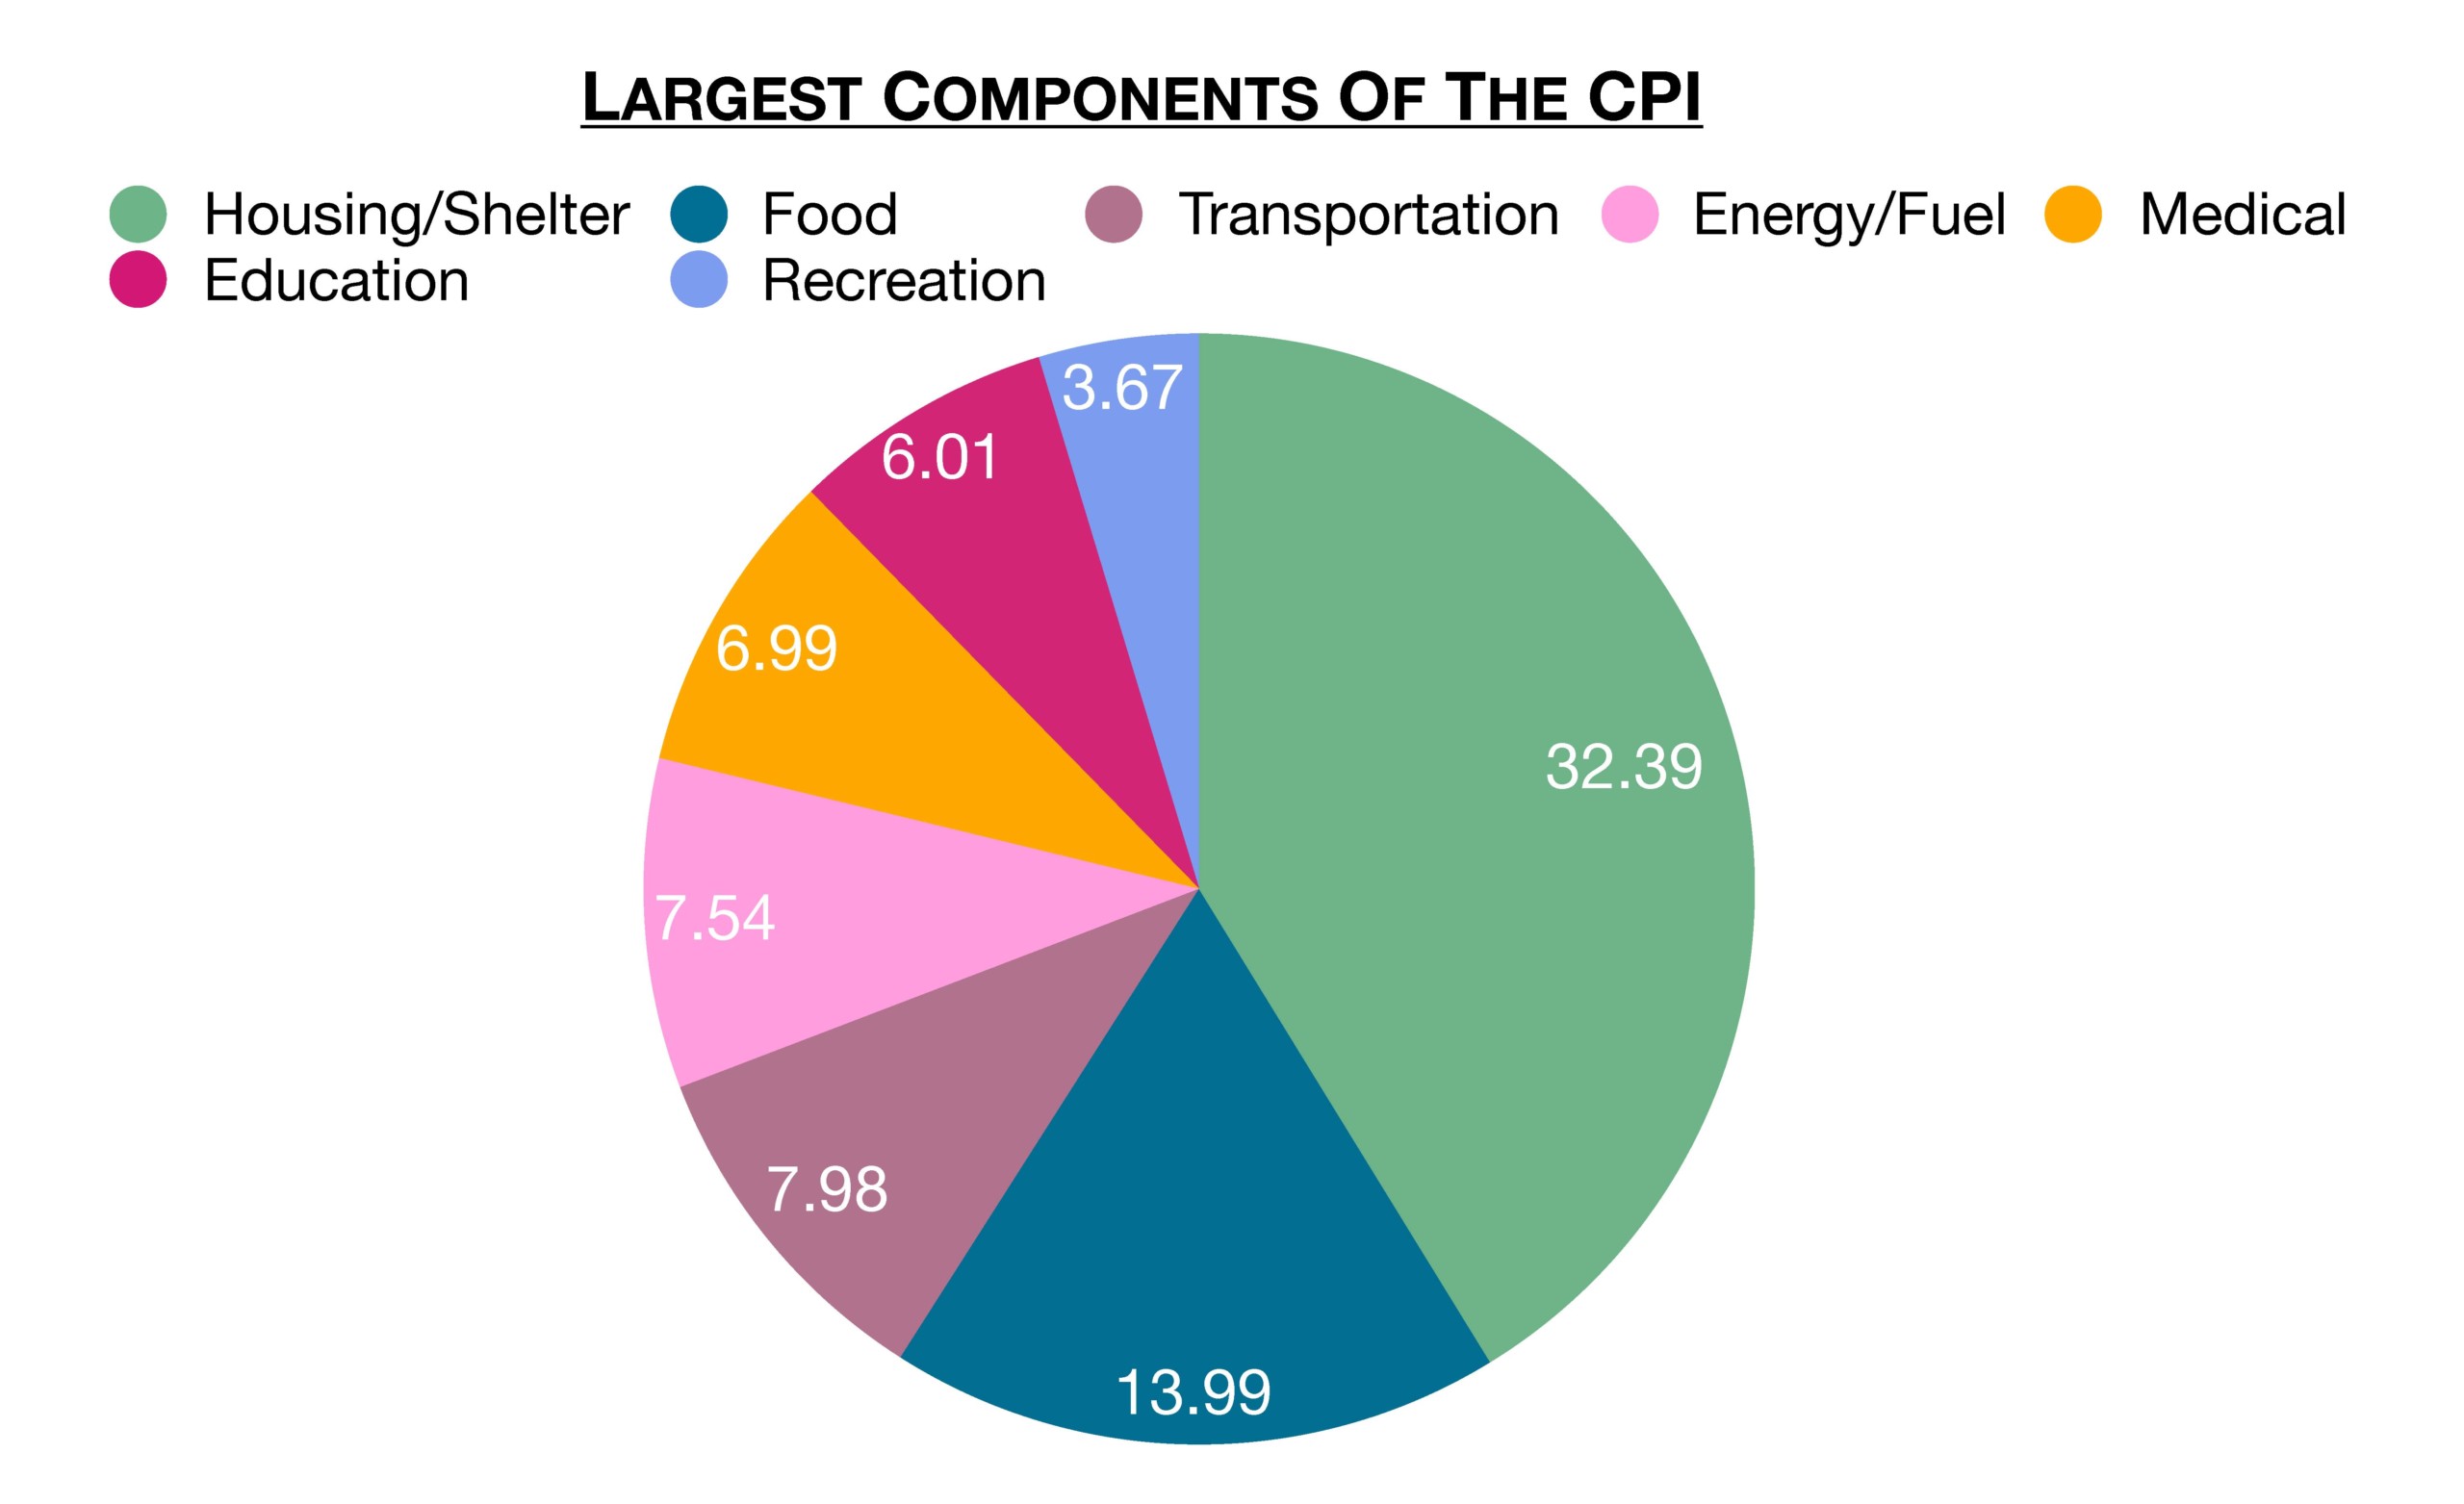
Food and energy have become the two fastest rising expenses for consumers nationwide, as well as representing a larger proportion of total living costs. Currently, 21.5% of the Consumer Price Index (CPI) is composed of food and energy expenditures, where the cost of groceries alone were 6.5% higher and the price of gasoline 50.8% higher than a year ago.
The concern that many economists have identified is that as millions of Americans are spending more on food and energy, they have less to spend on what they’d truly desire or want, also known as discretionary goods. As funds for discretionary items become scarce, economic growth suffers as sales of cars, furniture, clothing, and dining out become less affordable for millions of consumers.
Historically, food and energy prices have always been very volatile, making up more or less of consumer expenditures over time. Where consumers live and how old they are also dictates how influential components of the CPI are. Gasoline for example is less expensive in Oklahoma than in California, and seniors may not spend any funds on education but may spend more on medical expenses.
Sources: Dept. of Labor, BLS
What Is Stagflation - Inflation Overview
Becoming more of a topic throughout the financial media is stagflation, characterized as an environment with minimal economic growth, inflation, and elevated unemployment. The last time the U.S. experienced stagflation was in the late 1970’s and early 1980’s, with only a small portion of consumers remembering what it was like.
Many economists believe that the inflation we are experiencing today is driven by supply constraints and not driven by heightened consumer demand. Traditional periods of inflation have always evolved from excessive consumer demand supported by expanding wages. Currently, wages are not keeping up with inflation, thus producing diminishing incomes and consumer purchasing power.
Should wages fail to keep up with inflation, and economic growth begin to falter, then the risk of stagflation increases. Unemployment may increase concurrently should companies decide to reduce staff and cut positions as an economic slowdown sets in.
Source: Federal Reserve Bank of Kansas City
How The Three Super Powers Have Evolved As The World’s Top Energy Producers - Energy Focus
For decades, Russia, also known as the former Soviet Union before 1991, the United States, and China have dominated global energy production. Energy is a vital component to the survival and expansion of any economy worldwide. Over the years, the development of new technologies allowed the production of cleaner and more renewable fuels, many of which have been embraced by numerous countries.
China grew its energy production growth from 26 quadrillion Btu annually in 1985 to over 123 quadrillion Btu in 2019 which is primarily attributed to coal production. As the world’s largest producer of coal with over 3.7 billion tons annually, China far outproduces the U.S. with 640 million tons of coal per year.
Many analysts believe that a ban on Russian oil imports may prove to be inconsequential as the 22 million barrels imported monthly from Russia essentially equates to one days worth of U.S. oil production, of which is roughly 18 million barrels
Canada and Saudi Arabia are among the top five energy producers, primarily producing petroleum and crude oil products. The U.S. and Russia are significant producers of natural gas, which burns cleaner than petroleum products and is used globally.
Sources: EIA, OECD
What Commodities Have Been Most Affected - Global Dynamics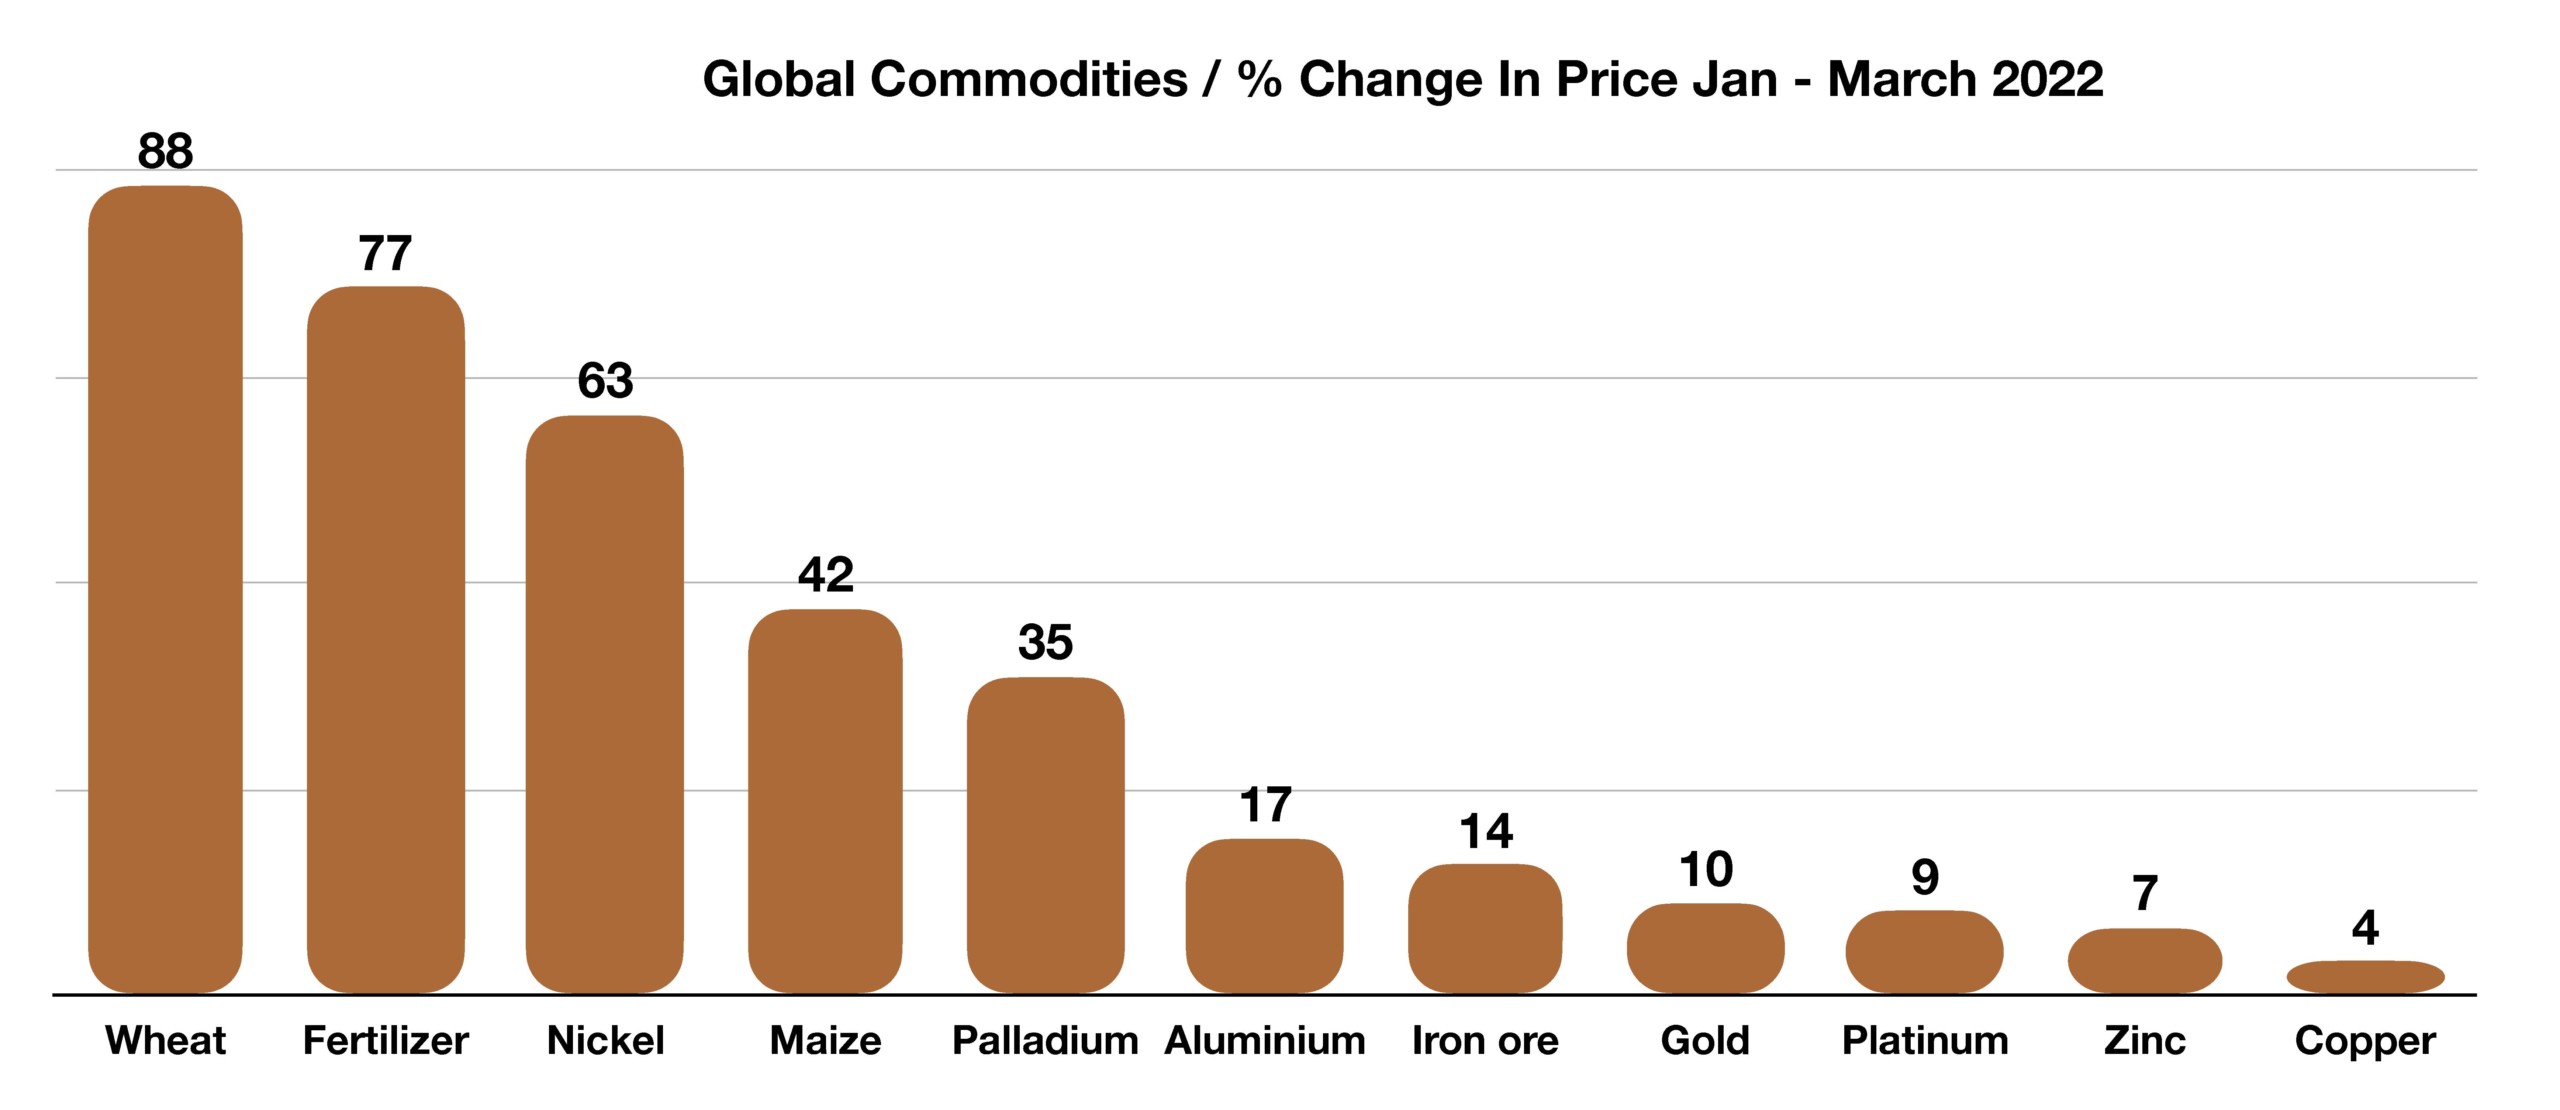
Global commodity prices have experienced extreme volatility since the inception of the Russian invasion of Ukraine. Of concern is that many of the affected commodities are essential to food production and industrial manufacturing worldwide. As exports of some of these commodities from Russia and Ukraine have cratered since the war began, supply issues have become critical and prices have rapidly risen.
Food related commodities such as wheat and fertilizer have risen substantially, raising food production costs to developed and poorer, emerging economies already struggling with food shortages. Metals such as nickel, palladium, aluminum and copper are widely used in manufacturing and industrial production, affecting the technology and automotive sectors.
Sources: World Bank; International Energy Agency; and OECD Agricultural Outlook database
**Market Returns: All data is indicative of total return which includes capital gain/loss and reinvested dividends for noted period. Index data sources; MSCI, DJ-UBSCI, WTI, IDC, S&P. The information provided is believed to be reliable, but its accuracy or completeness is not warranted. This material is not intended as an offer or solicitation for the purchase or sale of any stock, bond, mutual fund, or any other financial instrument. The views and strategies discussed herein may not be appropriate and/or suitable for all investors. This material is meant solely for informational purposes, and is not intended to suffice as any type of accounting, legal, tax, or estate planning advice. Any and all forecasts mentioned are for illustrative purposes only and should not be interpreted as investment recommendations.