
Macro Overview – April 2018
Markets were rattled in March as a looming trade war between China and the U.S. enhanced market volatility. The administration announced $60 billion in tariffs for Chinese imports, with a detailed list of products which will be identified by the Commerce Department in April. China threatened to retaliate by imposing tariffs on U.S. imports as well as curbing U.S. Treasury purchases.
Intricate supply chains have evolved between the United States and China over the past twenty years. Some U.S. manufacturers ship U.S. made components to China for final assembly, then ship finished products back into the U.S., thus posing a challenge as to how trade deficits are calculated.
Key economic data released over the past month revealed that key data points were the strongest reported since 1998. The market has become much more dependent on data as it looks for signs of inflation and rising rates. Various analysts view current market volatility primarily driven by non-systemic events and isolated to specific events and individual company news.
A key lending benchmark, the Libor, has been rising steadily. The three-month U.S. dollar Libor rate surpassed 2% in early March, the highest level since 2008. Based in London, the Libor affects U.S. consumer loans, commercial loans, and adjustable rate mortgages.
Rapidly rising mortgage rates are dampening the hopes of families eager to lock in rates before payments start to become too expensive. The continued lack of housing supplies has added a double cost factor to the market, with prices elevating due to tight supplies and rising mortgage rates.
The International Energy Association (IEA) projects that the United States is on track to become the worlds single largest oil producer by 2023.
The estimates are based on production growth and supplies generated by U.S. energy producers over the next few years. U.S. daily oil production alone is expected to reach over 12 million barrels per day by 2023, a 20% increase from the current levels of 10 million barrels per day.
Congress reached a $1.3 trillion budget deal that will fund the federal government through September. The extensive 2,232 page bill averts a government shut down and funds special programs for child care, infrastructure, medical research, opioid abuse prevention, and national security.
The IRS audited roughly 0.05% (half of one percent) of the 195,614,161 returns filed for tax year 2016. The number of examinations, also know as audits, was higher in the mid 1990s, when about 1.7% of returns were audited.
Sources: Dept. of Commerce, Bloomberg, congress.gov, IEA
Rates Stabilize In March - Fixed Income Overview
Equity market volatility in March drove assets towards various sectors of the bond market, thus pushing yields slightly lower and various fixed income prices higher
A key leading rate, the Libor, rose the most in 10 years. Debt reliant companies and consumers with variable rate loans tied to the Libor are most susceptible. The three month Libor rate rose to 2.31% at the end of the quarter.
The six-month Treasury bill reached a yield of 1.88% in early March, an important yield because that’s exactly what the S&P 500 Index yields. Some income seeking investors may begin to view short-term bonds as an attractive alternative to dividend paying stocks prone to market volatility.
The Federal Reserve decided to raise the Fed Funds rate to a range of 1.5 – 1.75%, on track for another three rate increases this year. Language from the Fed Chief Jerome Powell shed some optimism on economic activity, noting that “the economic outlook has strengthened in recent months”, warranting further increases in the Fed Funds rate.
Sources: Federal Reserve, Bloomberg
Tech & Tariff Influenced Volatility - Equity Update
Technology stocks led volatility in the first quarter, pulling other sectors into trading frenzies. Over 25% of the S&P 500 Index is currently comprised of technology stocks, having added volatility to the index for the first quarter. Trade war rhetoric added to volatility as U.S. companies sensitive to higher import prices on raw materials and certain finished goods experienced pullbacks
Companies in the technology sector faltered as privacy concerns drove social media shares lower. The technology sector has also became more prone to volatility leading to gyrating valuations. In addition, news of heightened regulatory rules for technology and social media related companies escalated a sell off heading into the second quarter.
Transportation stocks are rising more closely with the rest of the market, an optimistic signal according to the century old Dow Theory.
Sources: Dow Jones, S&P, Bloomberg
65 Year Olds Projected To Exceed 18 Year Olds - Demographics
Demographics and population data are carefully tracked by the Census Bureau in order to better determine what the United States may look like in the future.
Over 73 million minors, under 18 years of age, currently out number 49 million older Americans, 65 and over. Younger citizens help spur economic growth and provide essential workers for the labor market. The demographical make-up of the country has been driven by the baby boom generation for decades. Those born between 1946 – 1964 have shaped the economic status of our country while providing economic growth and vitally skilled workers. The first wave of baby boomers reached 65 years of age in 2011, starting a massive shift of individuals from working status to retirement status.
The Census Bureau estimates that by 2035, those age 65 and older will begin to out number 18 and under. The number of 65 year olds and older will rise much faster than those 18 and younger creating a strain on the U.S. job market and economy. The shrinking pool of minors will eventually lead to lower population growth thus creating a drag on economic growth. A growing elderly population is expected to impact already strained Medicare and Social Security benefits.
Source: U.S. Census Bureau
What Occupations Are Expected To Grow - Labor Market Update
Job creation and expansion is becoming prevalent in almost every major sector of the U.S. economy. Of the various sectors, construction, retail trade, and business services are seeing the most job growth.
Aiding labor markets as well is the the participation rate among prime age workers (25-54 year olds), which has risen to levels not seen since before the financial crisis of 2008.
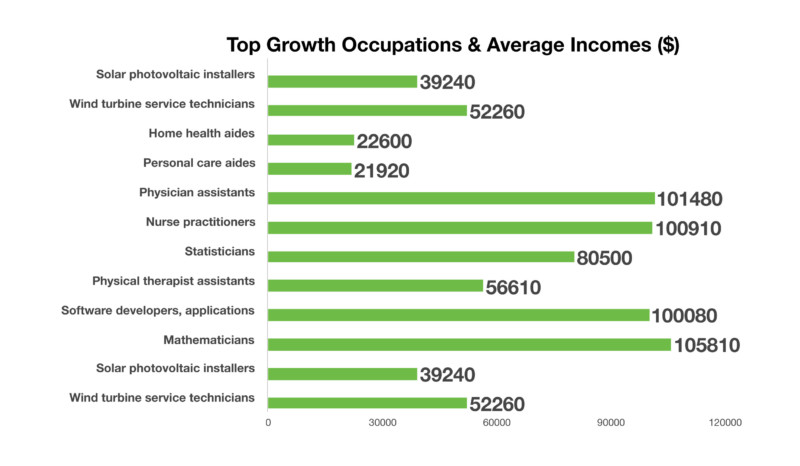
The Bureau of Labor Statistics developed an ongoing assessment of growing occupations within the U.S. labor markets, known as the Occupational Employment Statistics Program. The most recent data from the program has identified and projected what the fastest growing occupations are expected to be over the next 8 years. The data include projections from 2016 to 2026.
The program projects the largest job growth to occur in the renewable energy and health care sectors. Solar panel installers, wind turbine technicians, home health care aides and nurse practitioners are among the fastest growth occupations.
A variety of factors determine where the growth will be, including regulatory, technology, demographics, and economic activity.
Source: Labor Department
 **Market Returns: All data is indicative of total return which includes capital gain/loss and reinvested dividends for noted period. Index data sources; MSCI, DJ-UBSCI, WTI, IDC, S&P. The information provided is believed to be reliable, but its accuracy or completeness is not warranted. This material is not intended as an offer or solicitation for the purchase or sale of any stock, bond, mutual fund, or any other financial instrument. The views and strategies discussed herein may not be appropriate and/or suitable for all investors. This material is meant solely for informational purposes, and is not intended to suffice as any type of accounting, legal, tax, or estate planning advice. Any and all forecasts mentioned are for illustrative purposes only and should not be interpreted as investment recommendations.